롱
Strat long term Chart analysis
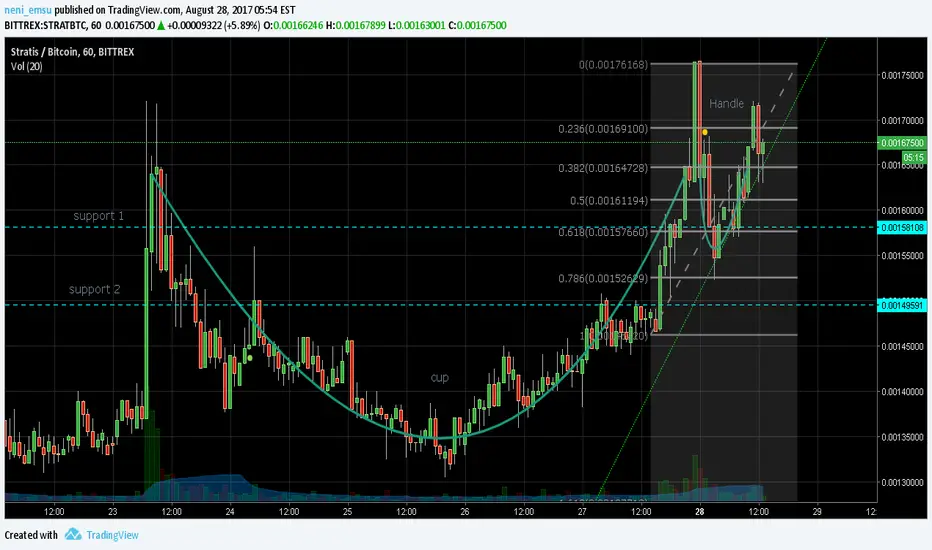
-A nice rounded bottom chart seen as the cup and handle formation comes in for a possible bullish trend confirmed by the new uptrend formed by the second part of the handle.
-Volume seams to have significantly increased.
-MACD indicates a short correction and also an increase in momentum
-If the candles break bellow trend line it would be expected to bounce at the support 1 61.8 Fibonacci line which is also a strongly tested support level.
-Further correction would see the charts move towards the second support and possibly a massive swing up.
Note:
-check for mote information Fundamental and Sentimental analysis to support finding before proceeding.
Do comment your thoughts and questions, Thank you.
-Volume seams to have significantly increased.
-MACD indicates a short correction and also an increase in momentum
-If the candles break bellow trend line it would be expected to bounce at the support 1 61.8 Fibonacci line which is also a strongly tested support level.
-Further correction would see the charts move towards the second support and possibly a massive swing up.
Note:
-check for mote information Fundamental and Sentimental analysis to support finding before proceeding.
Do comment your thoughts and questions, Thank you.

면책사항
해당 정보와 게시물은 금융, 투자, 트레이딩 또는 기타 유형의 조언이나 권장 사항으로 간주되지 않으며, 트레이딩뷰에서 제공하거나 보증하는 것이 아닙니다. 자세한 내용은 이용 약관을 참조하세요.
면책사항
해당 정보와 게시물은 금융, 투자, 트레이딩 또는 기타 유형의 조언이나 권장 사항으로 간주되지 않으며, 트레이딩뷰에서 제공하거나 보증하는 것이 아닙니다. 자세한 내용은 이용 약관을 참조하세요.