Stellar 4 Hour study.
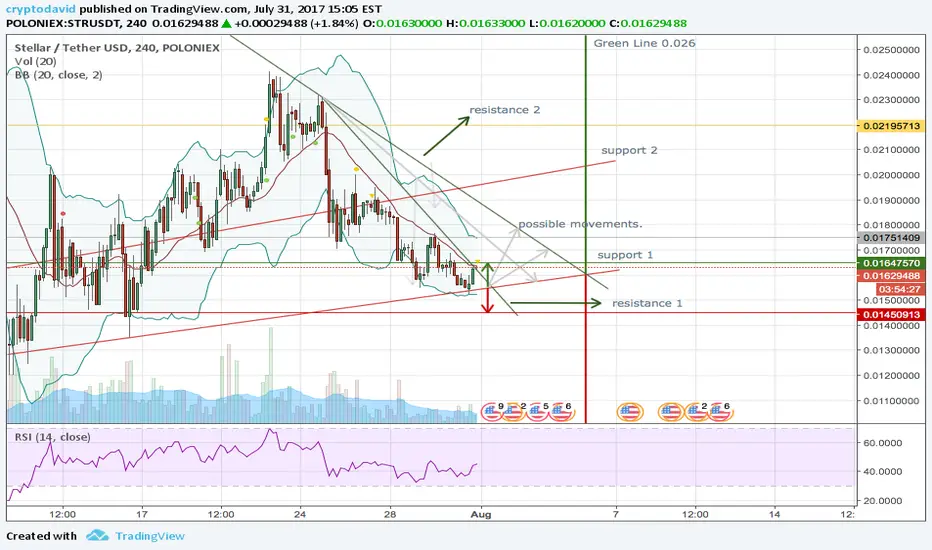
4 hour scenario
Breaking lines
First pair of lines
green line (resistance1) move towards 0.016 (Bollinger open up to 0.017)
red line (support1) move towards 0.014
Second pair of lines
Green line (resistance2) move towards 0.026
red line (support2) move towards 0.006
Market Cap 174.300.000
Shape could indicate double bottom, let´s see where it moves.
Wait for confirmation.
Breaking lines
First pair of lines
green line (resistance1) move towards 0.016 (Bollinger open up to 0.017)
red line (support1) move towards 0.014
Second pair of lines
Green line (resistance2) move towards 0.026
red line (support2) move towards 0.006
Market Cap 174.300.000
Shape could indicate double bottom, let´s see where it moves.
Wait for confirmation.

면책사항
해당 정보와 게시물은 금융, 투자, 트레이딩 또는 기타 유형의 조언이나 권장 사항으로 간주되지 않으며, 트레이딩뷰에서 제공하거나 보증하는 것이 아닙니다. 자세한 내용은 이용 약관을 참조하세요.
면책사항
해당 정보와 게시물은 금융, 투자, 트레이딩 또는 기타 유형의 조언이나 권장 사항으로 간주되지 않으며, 트레이딩뷰에서 제공하거나 보증하는 것이 아닙니다. 자세한 내용은 이용 약관을 참조하세요.