
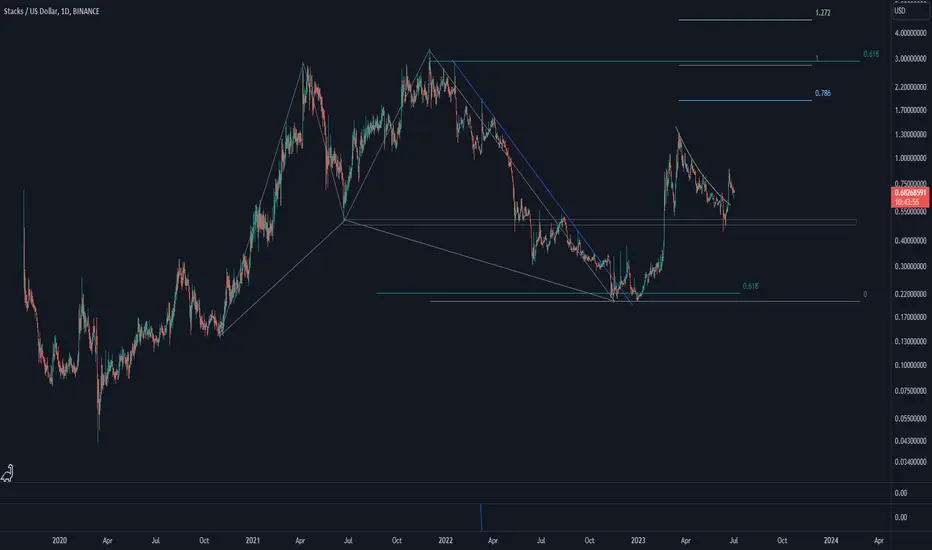
Stacks started its upward impulse wave sooner than others. Back when a harmonic pattern ended and price settled on 0.618 Fibonacci level, STX started a strong upward wave. After a 500% growth, corrective wave started. Now it seems STX posed for continuation. Let's see what happens.
노트
STX is breaking the second curved downtrend line. Let's see how up it can go.
노트
STX broke the descending triangle correction pattern is going up.
노트
STX broke the major downtrend line, and broke it with momentum. This behavior could be sign of powerful upward impulse wave indicating that STX could see much higher price. Let's see what happens.
노트
After STX broke the major downtrend line, it went up, and still going. Now, STX is approaching the intersection of the major horizontal area and the possible ascending channel's upper line. Let's see how STX reacts to these areas.
노트
So, STX went up very well and reached both the ascending channel's upper line and major horizontal resistance area. Unless important news about STX cause to burst through this area upward, correction is most likely to happen. Let's see what happens.
노트
So, correction brought STX down to the channel's middle line. Let's see if STX's correction ends here and an upward move starts or not.
노트
So, STX went down to the channel's lower line. Recently, STX broke the downtrend line, and it seems ready for the next upward phase. Let's see what happens.

면책사항
해당 정보와 게시물은 금융, 투자, 트레이딩 또는 기타 유형의 조언이나 권장 사항으로 간주되지 않으며, 트레이딩뷰에서 제공하거나 보증하는 것이 아닙니다. 자세한 내용은 이용 약관을 참조하세요.
면책사항
해당 정보와 게시물은 금융, 투자, 트레이딩 또는 기타 유형의 조언이나 권장 사항으로 간주되지 않으며, 트레이딩뷰에서 제공하거나 보증하는 것이 아닙니다. 자세한 내용은 이용 약관을 참조하세요.