
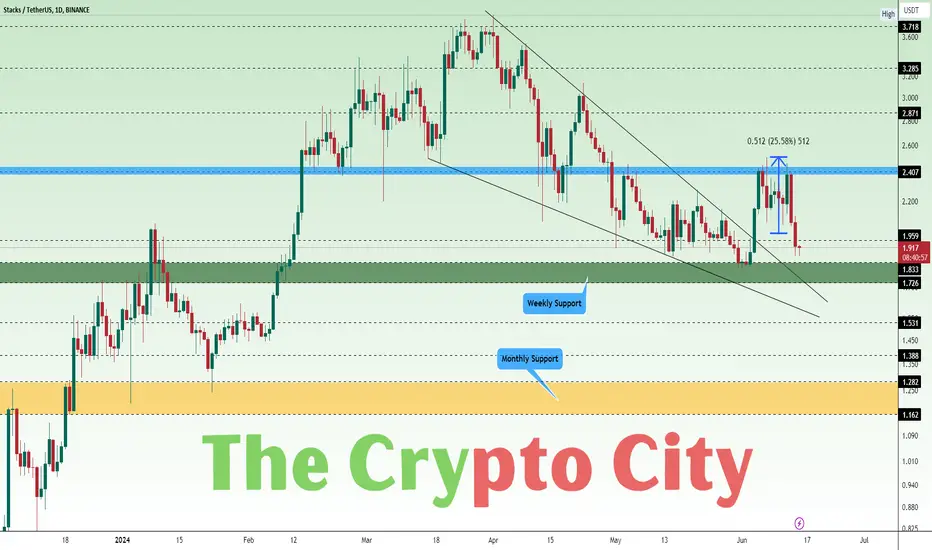
The STX/USDT daily chart presents a comprehensive look at the current market dynamics, indicating significant levels of support and resistance, as well as a falling wedge that has been broken out and in play since April.
After breakout from the falling wedge the price pumped 25% and rejected from a blue zone at $2.441 multiple times, after a pullback price now near weekly support zone (Green) at $1.726 - $1.833.
If the price bounced back from the green zone and trend line after a confirm retest we could see a massive pull back and it will form a new highs.That’s a bullish scenario.
In a bearish scenario, if a green zone did not holds the price of STX we could see it to test the next levels and finally the yellow zone at $1.162 - $1.282.
If the price reached the yellow zone that is the best place for loading our bags.
According to our analysis we are in favor of the price will bounce back from the green zone and trend line after retesting.
Remember, always use stop loss to secure your funds.
After breakout from the falling wedge the price pumped 25% and rejected from a blue zone at $2.441 multiple times, after a pullback price now near weekly support zone (Green) at $1.726 - $1.833.
If the price bounced back from the green zone and trend line after a confirm retest we could see a massive pull back and it will form a new highs.That’s a bullish scenario.
In a bearish scenario, if a green zone did not holds the price of STX we could see it to test the next levels and finally the yellow zone at $1.162 - $1.282.
If the price reached the yellow zone that is the best place for loading our bags.
According to our analysis we are in favor of the price will bounce back from the green zone and trend line after retesting.
Remember, always use stop loss to secure your funds.

면책사항
해당 정보와 게시물은 금융, 투자, 트레이딩 또는 기타 유형의 조언이나 권장 사항으로 간주되지 않으며, 트레이딩뷰에서 제공하거나 보증하는 것이 아닙니다. 자세한 내용은 이용 약관을 참조하세요.
면책사항
해당 정보와 게시물은 금융, 투자, 트레이딩 또는 기타 유형의 조언이나 권장 사항으로 간주되지 않으며, 트레이딩뷰에서 제공하거나 보증하는 것이 아닙니다. 자세한 내용은 이용 약관을 참조하세요.