
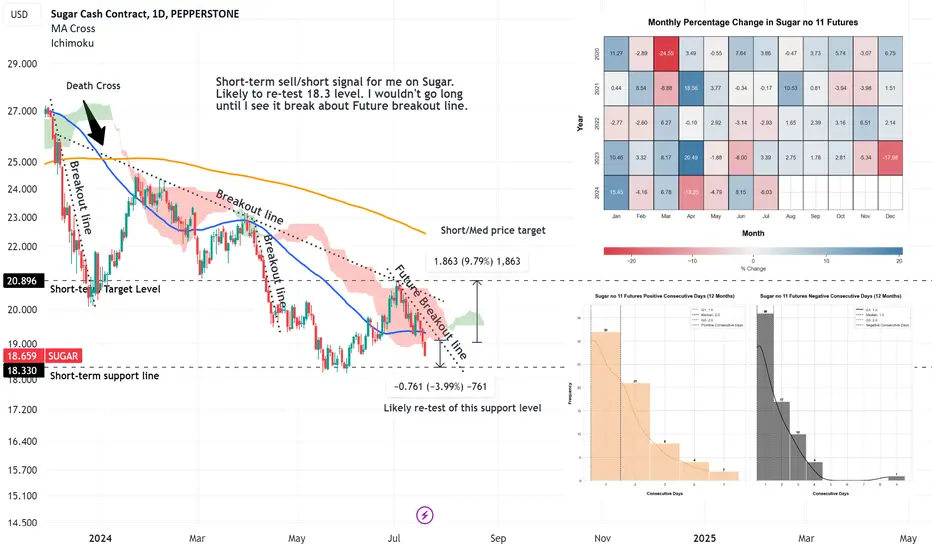
Short-term analysis of Sugar no11. Including 2 statistical charts showing the % monthly price changes over the last 5 years and a chart detailing the occurrence of consecutive positive and negative days "candles" and their frequency over 12 months.
- I expect more selling in July and then a rebound in August.
- Follow me on my socials for more detailed content
- I expect more selling in July and then a rebound in August.
- Follow me on my socials for more detailed content

면책사항
해당 정보와 게시물은 금융, 투자, 트레이딩 또는 기타 유형의 조언이나 권장 사항으로 간주되지 않으며, 트레이딩뷰에서 제공하거나 보증하는 것이 아닙니다. 자세한 내용은 이용 약관을 참조하세요.
면책사항
해당 정보와 게시물은 금융, 투자, 트레이딩 또는 기타 유형의 조언이나 권장 사항으로 간주되지 않으며, 트레이딩뷰에서 제공하거나 보증하는 것이 아닙니다. 자세한 내용은 이용 약관을 참조하세요.