
📊 Structural & Technical Analysis (SUIUSD)
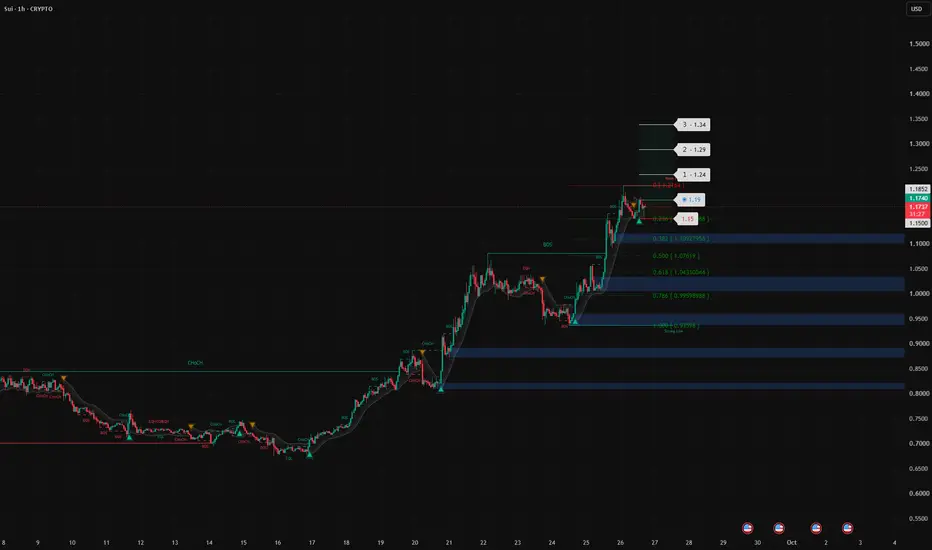
SUI (SUIUSD) is displaying a highly resilient structural framework on the 1-hour (1H) chart [image_bLUbSi.png]. Following a standard technical distribution phase from its local premium boundaries, the price action has successfully gravitated toward heavy horizontal accumulation shelves. The asset is printing a clear higher-low configuration, signaling that selling pressure is exhausting at major Fibonacci support levels.
Looking strictly at the precise technical geometry of the hourly chart:
1. Support Validation: The price is holding firm around the $1.1748 zone, actively defending the critical Fibonacci retracement floor [image_bLUbSi.png]. This structural cushion represents a high-confluence demand anchor where institutional buying interest is stepping back in.
2. Order Flow & Continuation: The market is currently consolidating, building local energy below structural overhead lines. A clean continuation past immediate micro-resistance will fully shift the short-term velocity back in alignment with the major impulse uptrend.
3. Invalidation Parameters: Risk parameters are structurally secure, with defensive coverage anchored beneath the absolute local swing floor to isolate the setup from any near-term liquidity-grab volatility.
🛠️ My Trading Plan (Upside Extensions):
• Entry Zone: Around $1.1748 (Positioning directly into the live stabilization base)
• Invalidation (Stop Loss): Placed strictly at $1.15 to safeguard core trading capital
• Target 1 (TP1): $1.24 (Immediate horizontal resistance shelf and near-term liquidity target)
• Target 2 (TP2): $1.29 (Primary swing target / High-volume supply boundary - Recommended)
• Target 3 (TP3): $1.34 (Major mathematical extension targeting previous local peaks)
What is your technical outlook on SUI as it builds a fresh structural floor above the Fibonacci grid? Let me know in the comments below, and don't forget to support this analysis with a boost!
*DISCLAIMER: This post is for educational and technical analysis purposes only. It does not constitute investment or financial advice. Always practice strict risk management.*
SUI (SUIUSD) is displaying a highly resilient structural framework on the 1-hour (1H) chart [image_bLUbSi.png]. Following a standard technical distribution phase from its local premium boundaries, the price action has successfully gravitated toward heavy horizontal accumulation shelves. The asset is printing a clear higher-low configuration, signaling that selling pressure is exhausting at major Fibonacci support levels.
Looking strictly at the precise technical geometry of the hourly chart:
1. Support Validation: The price is holding firm around the $1.1748 zone, actively defending the critical Fibonacci retracement floor [image_bLUbSi.png]. This structural cushion represents a high-confluence demand anchor where institutional buying interest is stepping back in.
2. Order Flow & Continuation: The market is currently consolidating, building local energy below structural overhead lines. A clean continuation past immediate micro-resistance will fully shift the short-term velocity back in alignment with the major impulse uptrend.
3. Invalidation Parameters: Risk parameters are structurally secure, with defensive coverage anchored beneath the absolute local swing floor to isolate the setup from any near-term liquidity-grab volatility.
🛠️ My Trading Plan (Upside Extensions):
• Entry Zone: Around $1.1748 (Positioning directly into the live stabilization base)
• Invalidation (Stop Loss): Placed strictly at $1.15 to safeguard core trading capital
• Target 1 (TP1): $1.24 (Immediate horizontal resistance shelf and near-term liquidity target)
• Target 2 (TP2): $1.29 (Primary swing target / High-volume supply boundary - Recommended)
• Target 3 (TP3): $1.34 (Major mathematical extension targeting previous local peaks)
What is your technical outlook on SUI as it builds a fresh structural floor above the Fibonacci grid? Let me know in the comments below, and don't forget to support this analysis with a boost!
*DISCLAIMER: This post is for educational and technical analysis purposes only. It does not constitute investment or financial advice. Always practice strict risk management.*
거래청산: 타겟 닿음

면책사항
해당 정보와 게시물은 금융, 투자, 트레이딩 또는 기타 유형의 조언이나 권장 사항으로 간주되지 않으며, 트레이딩뷰에서 제공하거나 보증하는 것이 아닙니다. 자세한 내용은 이용 약관을 참조하세요.
면책사항
해당 정보와 게시물은 금융, 투자, 트레이딩 또는 기타 유형의 조언이나 권장 사항으로 간주되지 않으며, 트레이딩뷰에서 제공하거나 보증하는 것이 아닙니다. 자세한 내용은 이용 약관을 참조하세요.