SUNTV1!
27-11
Daily chart of SUNTV1!
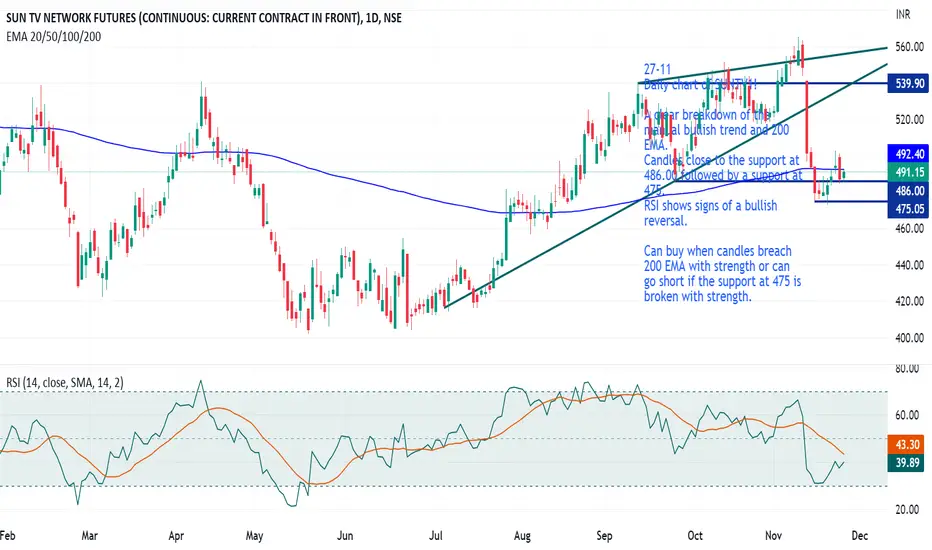
A clear breakdown of the manual bullish trend and 200 EMA.
Candles close to the support at 486.00 followed by a support at 475.
RSI shows signs of a bullish reversal.
Can buy when candles breach 200 EMA with strength or can go short if the support at 475 is broken with strength.
Daily chart of SUNTV1!
A clear breakdown of the manual bullish trend and 200 EMA.
Candles close to the support at 486.00 followed by a support at 475.
RSI shows signs of a bullish reversal.
Can buy when candles breach 200 EMA with strength or can go short if the support at 475 is broken with strength.

면책사항
해당 정보와 게시물은 금융, 투자, 트레이딩 또는 기타 유형의 조언이나 권장 사항으로 간주되지 않으며, 트레이딩뷰에서 제공하거나 보증하는 것이 아닙니다. 자세한 내용은 이용 약관을 참조하세요.
면책사항
해당 정보와 게시물은 금융, 투자, 트레이딩 또는 기타 유형의 조언이나 권장 사항으로 간주되지 않으며, 트레이딩뷰에서 제공하거나 보증하는 것이 아닙니다. 자세한 내용은 이용 약관을 참조하세요.