
### Swiggy Ltd. (4H) – Elliott Wave Analysis
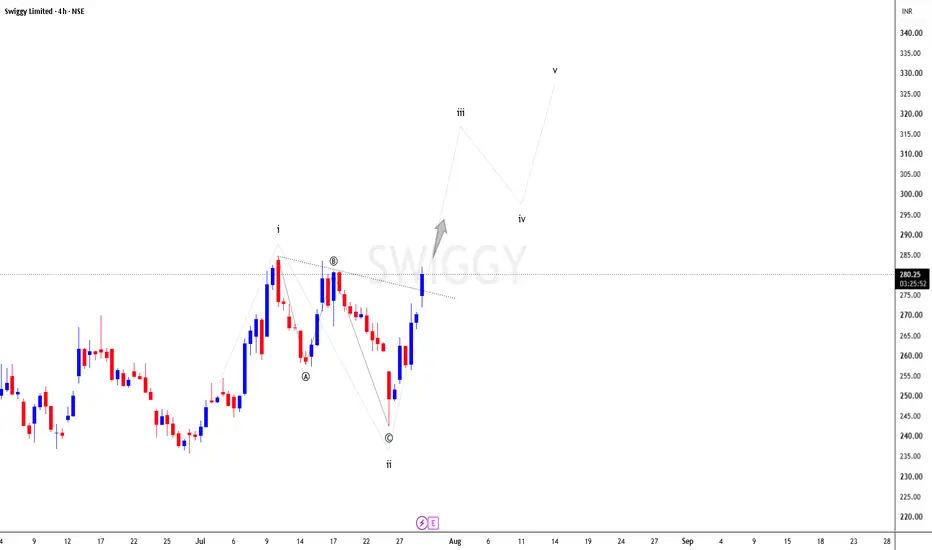
This chart shows a **4-hour (4H) Elliott Wave analysis** of **Swiggy Ltd.** and suggests that the stock may have completed an **A-B-C corrective pattern** and is beginning a new **five-wave bullish impulse**.
### Chart Description
* **A-B-C Correction Completed**
* **Wave A:** Initial decline from the previous high.
* **Wave B:** Temporary recovery (pullback).
* **Wave C:** Final decline, completing the correction.
* After **Wave C**, the stock has shown a **strong bullish reversal**, indicating that buyers are gaining control.
* The price is now attempting to **break above the descending trendline** (dotted line).
* A successful breakout could confirm the beginning of a new uptrend.
* The gray arrow on the chart represents the expected bullish move after the breakout.
### Elliott Wave Projection
The projected bullish structure consists of five waves:
* **Wave i:** The first upward move after the correction.
* **Wave ii:** A shallow pullback that should not fall below the start of Wave i.
* **Wave iii:** The strongest and longest wave, typically driven by high buying momentum.
* **Wave iv:** A healthy correction after Wave iii, usually without overlapping Wave i.
* **Wave v:** The final rally before another larger correction or a new A-B-C pattern begins.
### Current Market View
* The current price is around **$280** (chart value ₹280.10).
* The stock is trading near a **major descending resistance trendline**.
* If a **4-hour candle closes above this trendline with strong volume**, it could confirm the start of **Wave iii**, which is usually the most powerful bullish wave.
* If the breakout fails, the stock may experience a short-term pullback before attempting another rally.
### Potential Price Targets (Projection Only)
* **Wave iii:** Around **₹315–₹318**
* **Wave iv:** Around **₹295–₹300**
* **Wave v:** Around **₹328–₹332**
### Conclusion
The chart presents a **bullish Elliott Wave scenario**, where Swiggy appears to have completed its corrective phase and is preparing for a new impulsive uptrend. However, this projection becomes more reliable only after a confirmed breakout above the descending trendline with strong buying volume.
This chart shows a **4-hour (4H) Elliott Wave analysis** of **Swiggy Ltd.** and suggests that the stock may have completed an **A-B-C corrective pattern** and is beginning a new **five-wave bullish impulse**.
### Chart Description
* **A-B-C Correction Completed**
* **Wave A:** Initial decline from the previous high.
* **Wave B:** Temporary recovery (pullback).
* **Wave C:** Final decline, completing the correction.
* After **Wave C**, the stock has shown a **strong bullish reversal**, indicating that buyers are gaining control.
* The price is now attempting to **break above the descending trendline** (dotted line).
* A successful breakout could confirm the beginning of a new uptrend.
* The gray arrow on the chart represents the expected bullish move after the breakout.
### Elliott Wave Projection
The projected bullish structure consists of five waves:
* **Wave i:** The first upward move after the correction.
* **Wave ii:** A shallow pullback that should not fall below the start of Wave i.
* **Wave iii:** The strongest and longest wave, typically driven by high buying momentum.
* **Wave iv:** A healthy correction after Wave iii, usually without overlapping Wave i.
* **Wave v:** The final rally before another larger correction or a new A-B-C pattern begins.
### Current Market View
* The current price is around **$280** (chart value ₹280.10).
* The stock is trading near a **major descending resistance trendline**.
* If a **4-hour candle closes above this trendline with strong volume**, it could confirm the start of **Wave iii**, which is usually the most powerful bullish wave.
* If the breakout fails, the stock may experience a short-term pullback before attempting another rally.
### Potential Price Targets (Projection Only)
* **Wave iii:** Around **₹315–₹318**
* **Wave iv:** Around **₹295–₹300**
* **Wave v:** Around **₹328–₹332**
### Conclusion
The chart presents a **bullish Elliott Wave scenario**, where Swiggy appears to have completed its corrective phase and is preparing for a new impulsive uptrend. However, this projection becomes more reliable only after a confirmed breakout above the descending trendline with strong buying volume.

면책사항
해당 정보와 게시물은 금융, 투자, 트레이딩 또는 기타 유형의 조언이나 권장 사항으로 간주되지 않으며, 트레이딩뷰에서 제공하거나 보증하는 것이 아닙니다. 자세한 내용은 이용 약관을 참조하세요.
면책사항
해당 정보와 게시물은 금융, 투자, 트레이딩 또는 기타 유형의 조언이나 권장 사항으로 간주되지 않으며, 트레이딩뷰에서 제공하거나 보증하는 것이 아닙니다. 자세한 내용은 이용 약관을 참조하세요.