
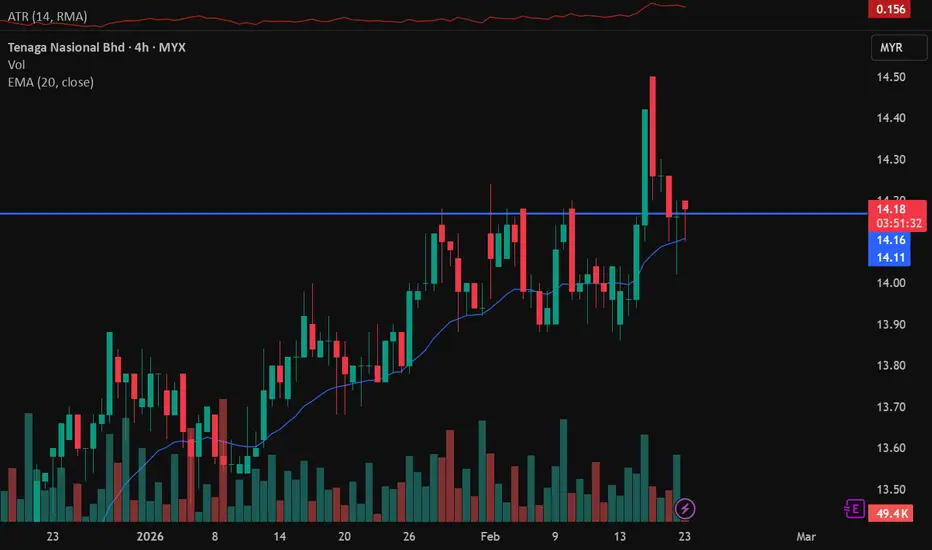
On the daily chart, the 14.16 level has been a level that's been retested multiple times. We could see price recently broke the level with increasing volumes indicating a strong bullish momentum. On the 4hr chart, we could see theres a doji candle in the retracement towards the area. A green candle after the doji would signal our entry as a candlestick pattern. Stops would be 1 atr below the lows aiming for a 1.4:1 risk reward ratio.

면책사항
해당 정보와 게시물은 금융, 투자, 트레이딩 또는 기타 유형의 조언이나 권장 사항으로 간주되지 않으며, 트레이딩뷰에서 제공하거나 보증하는 것이 아닙니다. 자세한 내용은 이용 약관을 참조하세요.
면책사항
해당 정보와 게시물은 금융, 투자, 트레이딩 또는 기타 유형의 조언이나 권장 사항으로 간주되지 않으며, 트레이딩뷰에서 제공하거나 보증하는 것이 아닙니다. 자세한 내용은 이용 약관을 참조하세요.