
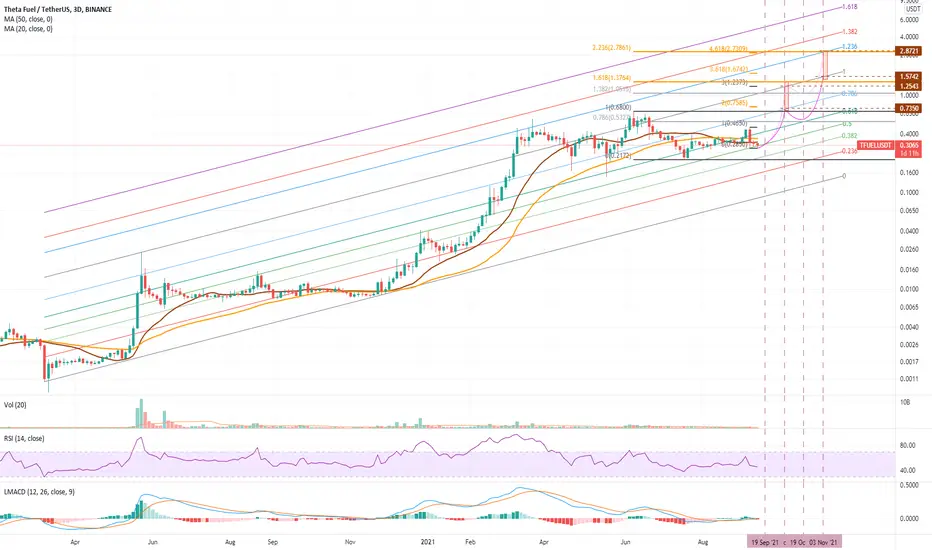
Re-running the TFUEL study in the Logarithmic scale and we see some clear and consistent structure to the market along the lines of a Fibonacci Channel.
Considering the completion of Wave 2 yesterday, this 3 Day Chart provides some insight and justification for higher targets for Wave 5.
Which do you think is more likely, the outcomes derived from previous Standard Scale chart or this Log Scale chart?
Considering the completion of Wave 2 yesterday, this 3 Day Chart provides some insight and justification for higher targets for Wave 5.
Which do you think is more likely, the outcomes derived from previous Standard Scale chart or this Log Scale chart?

관련 발행물
면책사항
해당 정보와 게시물은 금융, 투자, 트레이딩 또는 기타 유형의 조언이나 권장 사항으로 간주되지 않으며, 트레이딩뷰에서 제공하거나 보증하는 것이 아닙니다. 자세한 내용은 이용 약관을 참조하세요.
면책사항
해당 정보와 게시물은 금융, 투자, 트레이딩 또는 기타 유형의 조언이나 권장 사항으로 간주되지 않으며, 트레이딩뷰에서 제공하거나 보증하는 것이 아닙니다. 자세한 내용은 이용 약관을 참조하세요.