
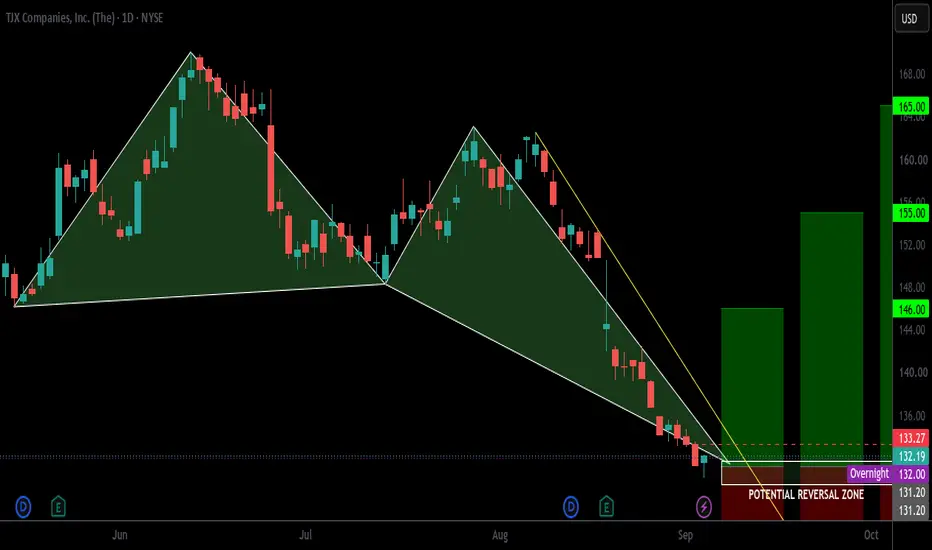
TJX is now trading into a Potential Reversal Zone created by a Bullish Deep Harmonic pattern. After the recent selloff, this area could provide a good opportunity for a bounce.
I’m not looking to jump in blindly at the PRZ. There are two levels I want to see break before getting more confident in the setup.
The Two Confirmation Levels
Yellow Trend Line:
This is the first important level. TJX has been trending lower along this line, so a break above it would be a good sign that the selling pressure is starting to weaken.
Red Dotted Ray — $133.27:
This is the second confirmation. A move above $133.27 would add strength to the reversal setup.
Trade Levels
Entry: Above $130, ideally after breaking the yellow trend line and holding above it.
Stop / Invalidation: $131.20
Targets:
TP1: $146
TP2: $155
TP3: $165
The idea here is simple: let price prove the reversal first. If TJX breaks the yellow trend line and then takes out $133.27, I would be looking for a move toward $146 first, followed by $155 and potentially $165.
If price loses $131.20, the bullish setup is no longer valid.
Patience is key here. The harmonic pattern gives us the area, but the price action gives us the confirmation.
I’m not looking to jump in blindly at the PRZ. There are two levels I want to see break before getting more confident in the setup.
The Two Confirmation Levels
Yellow Trend Line:
This is the first important level. TJX has been trending lower along this line, so a break above it would be a good sign that the selling pressure is starting to weaken.
Red Dotted Ray — $133.27:
This is the second confirmation. A move above $133.27 would add strength to the reversal setup.
Trade Levels
Entry: Above $130, ideally after breaking the yellow trend line and holding above it.
Stop / Invalidation: $131.20
Targets:
TP1: $146
TP2: $155
TP3: $165
The idea here is simple: let price prove the reversal first. If TJX breaks the yellow trend line and then takes out $133.27, I would be looking for a move toward $146 first, followed by $155 and potentially $165.
If price loses $131.20, the bullish setup is no longer valid.
Patience is key here. The harmonic pattern gives us the area, but the price action gives us the confirmation.

면책사항
해당 정보와 게시물은 금융, 투자, 트레이딩 또는 기타 유형의 조언이나 권장 사항으로 간주되지 않으며, 트레이딩뷰에서 제공하거나 보증하는 것이 아닙니다. 자세한 내용은 이용 약관을 참조하세요.
면책사항
해당 정보와 게시물은 금융, 투자, 트레이딩 또는 기타 유형의 조언이나 권장 사항으로 간주되지 않으며, 트레이딩뷰에서 제공하거나 보증하는 것이 아닙니다. 자세한 내용은 이용 약관을 참조하세요.