
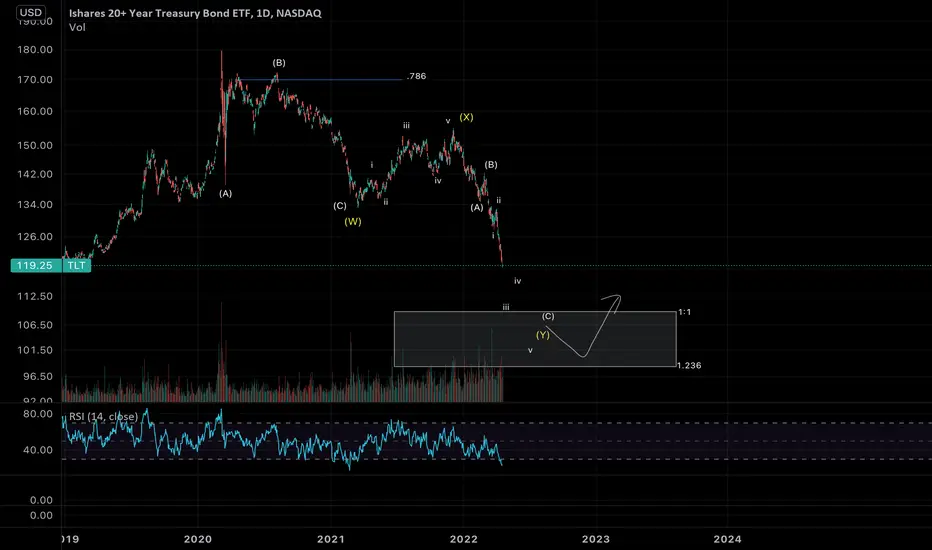
Applying simple Elliot wave analysis, I see an ABC pattern with a failed 5 wave move up marked as X wave, the first ABC is then labeled as W and projected 1:1 ratio from top of (X) brings us down to the box area, where TLT is most likely to find support (1:1 & 1.236 Fib ratio).
I see the price dropping without retest of major resistances that it broke through, and a price fall in a straight line is unsustainable, its like stretching a rubber band and eventually price will rebound violently.
I would give it a 60% probability of reversal at that point and daily bullish divergence should be a very strong sign of imminent reversal.
Cheers
I see the price dropping without retest of major resistances that it broke through, and a price fall in a straight line is unsustainable, its like stretching a rubber band and eventually price will rebound violently.
I would give it a 60% probability of reversal at that point and daily bullish divergence should be a very strong sign of imminent reversal.
Cheers

면책사항
해당 정보와 게시물은 금융, 투자, 트레이딩 또는 기타 유형의 조언이나 권장 사항으로 간주되지 않으며, 트레이딩뷰에서 제공하거나 보증하는 것이 아닙니다. 자세한 내용은 이용 약관을 참조하세요.
면책사항
해당 정보와 게시물은 금융, 투자, 트레이딩 또는 기타 유형의 조언이나 권장 사항으로 간주되지 않으며, 트레이딩뷰에서 제공하거나 보증하는 것이 아닙니다. 자세한 내용은 이용 약관을 참조하세요.