
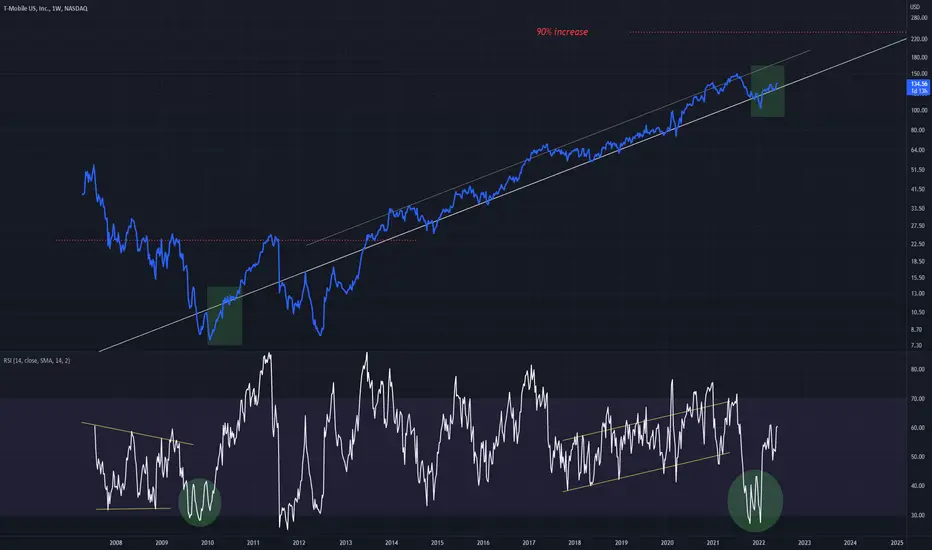
Similar structural patterns can be seen on both chart and RSI at green circle locations
In the first situation a 90% rise was seen on this Weekly chart
The second situation shows an RSI that is comparable
90% rise again?
In the first situation a 90% rise was seen on this Weekly chart
The second situation shows an RSI that is comparable
90% rise again?

면책사항
해당 정보와 게시물은 금융, 투자, 트레이딩 또는 기타 유형의 조언이나 권장 사항으로 간주되지 않으며, 트레이딩뷰에서 제공하거나 보증하는 것이 아닙니다. 자세한 내용은 이용 약관을 참조하세요.
면책사항
해당 정보와 게시물은 금융, 투자, 트레이딩 또는 기타 유형의 조언이나 권장 사항으로 간주되지 않으며, 트레이딩뷰에서 제공하거나 보증하는 것이 아닙니다. 자세한 내용은 이용 약관을 참조하세요.