롱
TNY update.
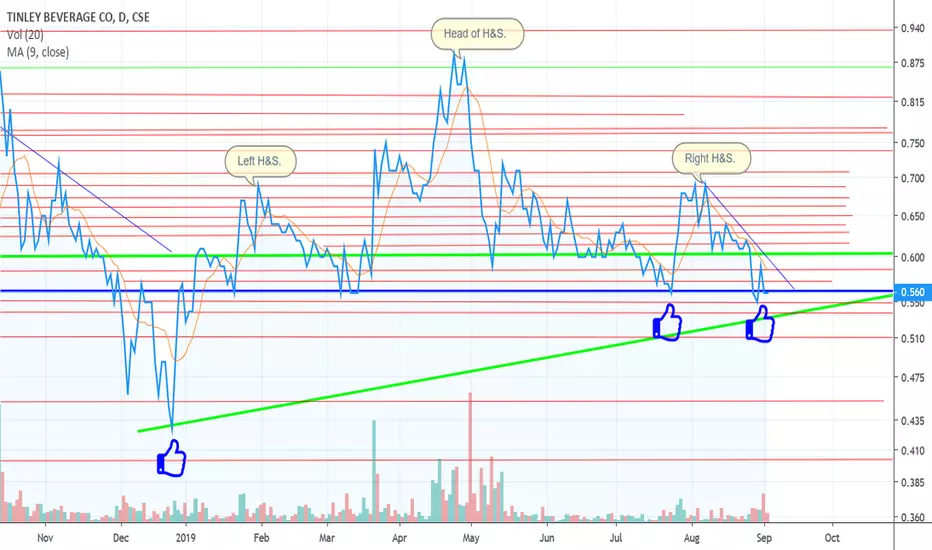
So, since the last time I posted a chart on TNY we were trading in descending triangle that broke to the downside on a "short term time frame." I had mentioned that the pattern could also be a bull flag, but that was not the case.
It is interesting however to see Tinley get back up to the 56c level where there seems to be historic support dating back to Aug 2018.
I can speculate all I want about where the share price may be in the future, but only time will tell per usual.
It is interesting however to see Tinley get back up to the 56c level where there seems to be historic support dating back to Aug 2018.
I can speculate all I want about where the share price may be in the future, but only time will tell per usual.

관련 발행물
면책사항
해당 정보와 게시물은 금융, 투자, 트레이딩 또는 기타 유형의 조언이나 권장 사항으로 간주되지 않으며, 트레이딩뷰에서 제공하거나 보증하는 것이 아닙니다. 자세한 내용은 이용 약관을 참조하세요.
면책사항
해당 정보와 게시물은 금융, 투자, 트레이딩 또는 기타 유형의 조언이나 권장 사항으로 간주되지 않으며, 트레이딩뷰에서 제공하거나 보증하는 것이 아닙니다. 자세한 내용은 이용 약관을 참조하세요.