
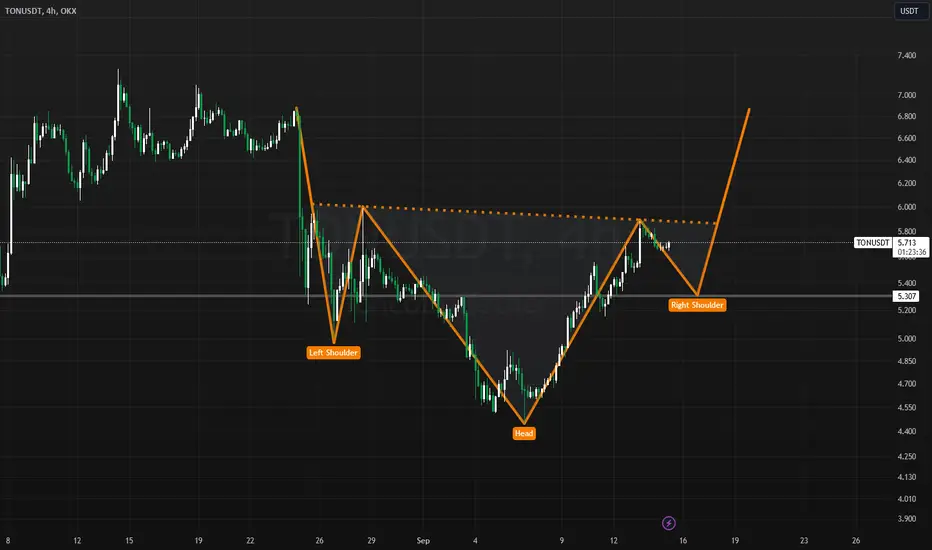
In the latest technical analysis, a bullish "Inverse Head and Shoulders" pattern has appeared. The price started at $6.8, dropping to $5 to form the left shoulder. It then rebounded to $6 before falling to a low of $4.4, marking the head. From there, the price surged back to $5.9, creating the right shoulder.
This pattern is often a strong indicator of a potential bullish reversal, signaling a possible upward move. Traders are now eagerly watching for a breakout above resistance levels, which could confirm the continuation of the uptrend. Will this be the beginning of a new rally?
The next price movement could set the stage for the market's short-term bullish momentum.
This pattern is often a strong indicator of a potential bullish reversal, signaling a possible upward move. Traders are now eagerly watching for a breakout above resistance levels, which could confirm the continuation of the uptrend. Will this be the beginning of a new rally?
The next price movement could set the stage for the market's short-term bullish momentum.

면책사항
해당 정보와 게시물은 금융, 투자, 트레이딩 또는 기타 유형의 조언이나 권장 사항으로 간주되지 않으며, 트레이딩뷰에서 제공하거나 보증하는 것이 아닙니다. 자세한 내용은 이용 약관을 참조하세요.
면책사항
해당 정보와 게시물은 금융, 투자, 트레이딩 또는 기타 유형의 조언이나 권장 사항으로 간주되지 않으며, 트레이딩뷰에서 제공하거나 보증하는 것이 아닙니다. 자세한 내용은 이용 약관을 참조하세요.