
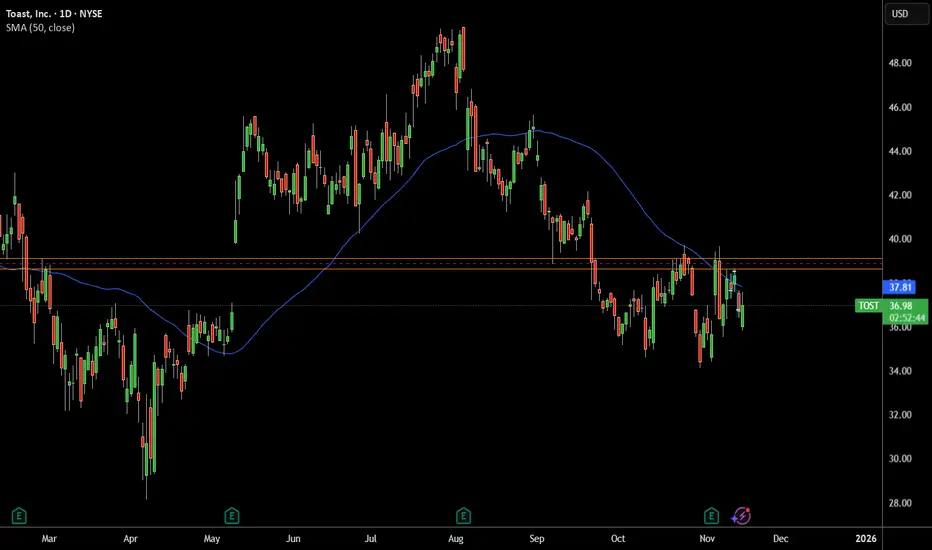
Price Rejected From Major Resistance
The stock is sitting right below a heavy resistance zone around $38–40, which has rejected price multiple times in the past.
Every time TOST comes near this zone, sellers step in → clear bearish supply area.
2. Below the 50-Day Moving Average
Price is trading under the 50 SMA (blue line).
In downtrending or weak stocks, the 50 SMA acts as dynamic resistance, pushing price lower.
3. Lower Highs Formation
The recent bounce failed to create a higher high.
Instead, TOST is forming lower highs, which is a classic bearish continuation signal.
4. Failed Breakout Attempt
TOST tried to break above the resistance but got instantly sold off.
This is a sign of weak buying demand and strong sellers.
The stock is sitting right below a heavy resistance zone around $38–40, which has rejected price multiple times in the past.
Every time TOST comes near this zone, sellers step in → clear bearish supply area.
2. Below the 50-Day Moving Average
Price is trading under the 50 SMA (blue line).
In downtrending or weak stocks, the 50 SMA acts as dynamic resistance, pushing price lower.
3. Lower Highs Formation
The recent bounce failed to create a higher high.
Instead, TOST is forming lower highs, which is a classic bearish continuation signal.
4. Failed Breakout Attempt
TOST tried to break above the resistance but got instantly sold off.
This is a sign of weak buying demand and strong sellers.
거래청산: 타겟 닿음

면책사항
해당 정보와 게시물은 금융, 투자, 트레이딩 또는 기타 유형의 조언이나 권장 사항으로 간주되지 않으며, 트레이딩뷰에서 제공하거나 보증하는 것이 아닙니다. 자세한 내용은 이용 약관을 참조하세요.
면책사항
해당 정보와 게시물은 금융, 투자, 트레이딩 또는 기타 유형의 조언이나 권장 사항으로 간주되지 않으며, 트레이딩뷰에서 제공하거나 보증하는 것이 아닙니다. 자세한 내용은 이용 약관을 참조하세요.