
Hi traders,
This market cap chart has helped me immensely these past few years, so I hope you enjoy this 2019 forecast on the weekly time frame.
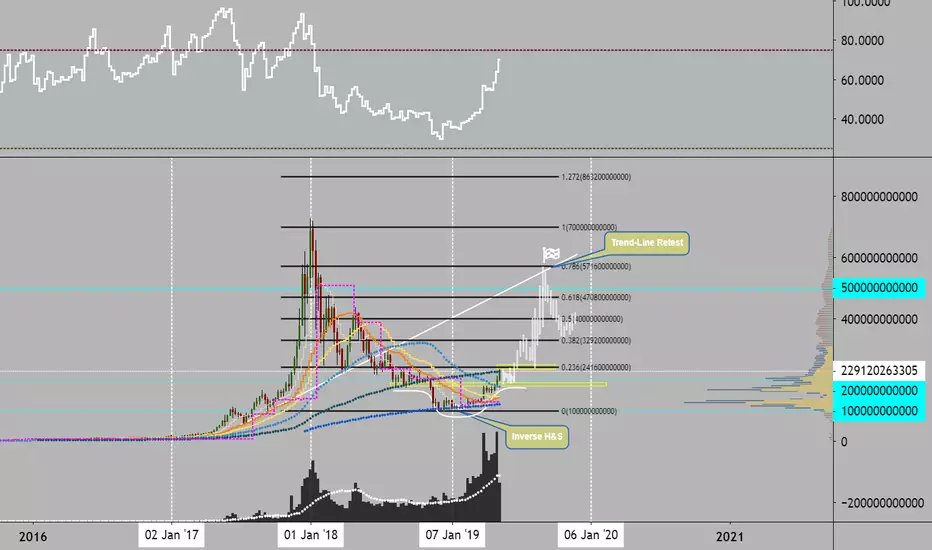
Just a few things i want to point out on the chart, that are making me extremely bullish about the prospects of another $250 billion entering this market:
1. The bottom is in - this is signaled by the 200 week MA in royal blue, and the key psychology level of $100 B which held firm in the early months of 2019.
2. We can now map a new swing high and swing low with the fib retracement tool, which shows that we are currently battling the first fib level resistance (23.6). I am expecting a bit of a pull-back off this level, and a few weeks spent battling the $200 bill mark (as BTC re-tests $6500), which could show us a nice inverse head and shoulders pattern to bolster our bullish momentum. Once we can clear the 23.6, it is game on for the higher fib levels (including the 50% and 61.8%) according to Fibonacci law.
The next big psych level for this market cap is $500 billion, which would represent a 100% return from here. Not exactly sure when we will see this figure, but i am confident it will be some point towards the end of 2019.
Remember, TA is not a science - forecasting out price action months ahead of time is highly speculative, and the drawings on chart is for visualization purposes only.
This analysis places BTC price around $15,000 | ETH $400 | LTC $175 | XRP $0.50 by the end of the year.
Best of luck, hit the thumbs up.
This market cap chart has helped me immensely these past few years, so I hope you enjoy this 2019 forecast on the weekly time frame.
Just a few things i want to point out on the chart, that are making me extremely bullish about the prospects of another $250 billion entering this market:
1. The bottom is in - this is signaled by the 200 week MA in royal blue, and the key psychology level of $100 B which held firm in the early months of 2019.
2. We can now map a new swing high and swing low with the fib retracement tool, which shows that we are currently battling the first fib level resistance (23.6). I am expecting a bit of a pull-back off this level, and a few weeks spent battling the $200 bill mark (as BTC re-tests $6500), which could show us a nice inverse head and shoulders pattern to bolster our bullish momentum. Once we can clear the 23.6, it is game on for the higher fib levels (including the 50% and 61.8%) according to Fibonacci law.
The next big psych level for this market cap is $500 billion, which would represent a 100% return from here. Not exactly sure when we will see this figure, but i am confident it will be some point towards the end of 2019.
Remember, TA is not a science - forecasting out price action months ahead of time is highly speculative, and the drawings on chart is for visualization purposes only.
This analysis places BTC price around $15,000 | ETH $400 | LTC $175 | XRP $0.50 by the end of the year.
Best of luck, hit the thumbs up.

면책사항
해당 정보와 게시물은 금융, 투자, 트레이딩 또는 기타 유형의 조언이나 권장 사항으로 간주되지 않으며, 트레이딩뷰에서 제공하거나 보증하는 것이 아닙니다. 자세한 내용은 이용 약관을 참조하세요.
면책사항
해당 정보와 게시물은 금융, 투자, 트레이딩 또는 기타 유형의 조언이나 권장 사항으로 간주되지 않으며, 트레이딩뷰에서 제공하거나 보증하는 것이 아닙니다. 자세한 내용은 이용 약관을 참조하세요.