
I noticed a similarity and thought I'd share
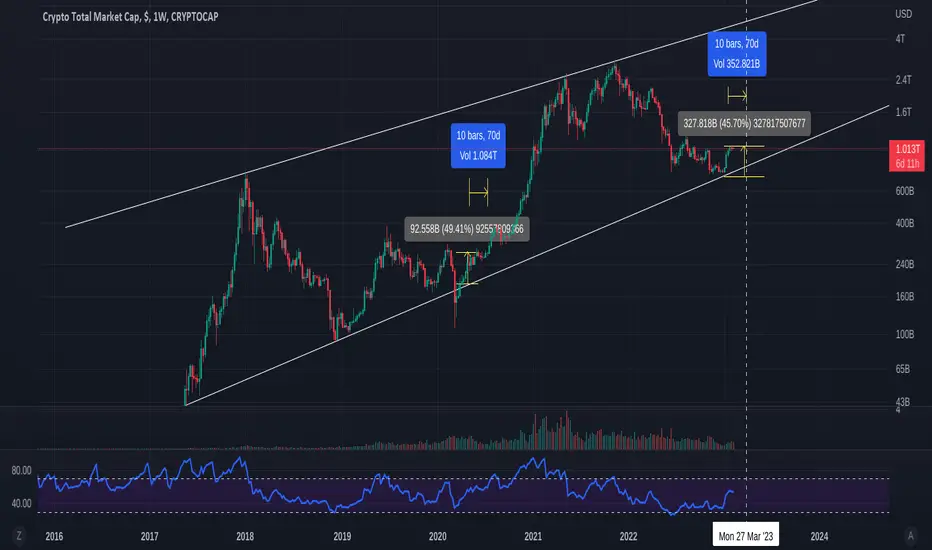
March 2020 Drop in PA was sudden and dramatic as was the V shape recovery.
What I noticed was the % of rise from the long term trendline to where PA levelled out, while it cooled off before the next move and what PA has Just done.
And as you can see, it is very similar and if PA takes 70 days to cool off, as it did before, that takes us to end of March, Which has confluence with other charts about when PA maybe making another Move.
I will stress that this is pure speculation and has no real proof..It is an idea.......but one worth watching I feel
March 2020 Drop in PA was sudden and dramatic as was the V shape recovery.
What I noticed was the % of rise from the long term trendline to where PA levelled out, while it cooled off before the next move and what PA has Just done.
And as you can see, it is very similar and if PA takes 70 days to cool off, as it did before, that takes us to end of March, Which has confluence with other charts about when PA maybe making another Move.
I will stress that this is pure speculation and has no real proof..It is an idea.......but one worth watching I feel

Nothing to be taken as Financial advice.
I will always say
"Only invest what you can afford to loose. When you are ready, take out your original investment. This way, it is only your profit that is at risk"
THAT is Financial advice
I will always say
"Only invest what you can afford to loose. When you are ready, take out your original investment. This way, it is only your profit that is at risk"
THAT is Financial advice
면책사항
해당 정보와 게시물은 금융, 투자, 트레이딩 또는 기타 유형의 조언이나 권장 사항으로 간주되지 않으며, 트레이딩뷰에서 제공하거나 보증하는 것이 아닙니다. 자세한 내용은 이용 약관을 참조하세요.
Nothing to be taken as Financial advice.
I will always say
"Only invest what you can afford to loose. When you are ready, take out your original investment. This way, it is only your profit that is at risk"
THAT is Financial advice
I will always say
"Only invest what you can afford to loose. When you are ready, take out your original investment. This way, it is only your profit that is at risk"
THAT is Financial advice
면책사항
해당 정보와 게시물은 금융, 투자, 트레이딩 또는 기타 유형의 조언이나 권장 사항으로 간주되지 않으며, 트레이딩뷰에서 제공하거나 보증하는 것이 아닙니다. 자세한 내용은 이용 약관을 참조하세요.