
Crypto Total Market Cap – Weekly Chart Analysis & Full Update
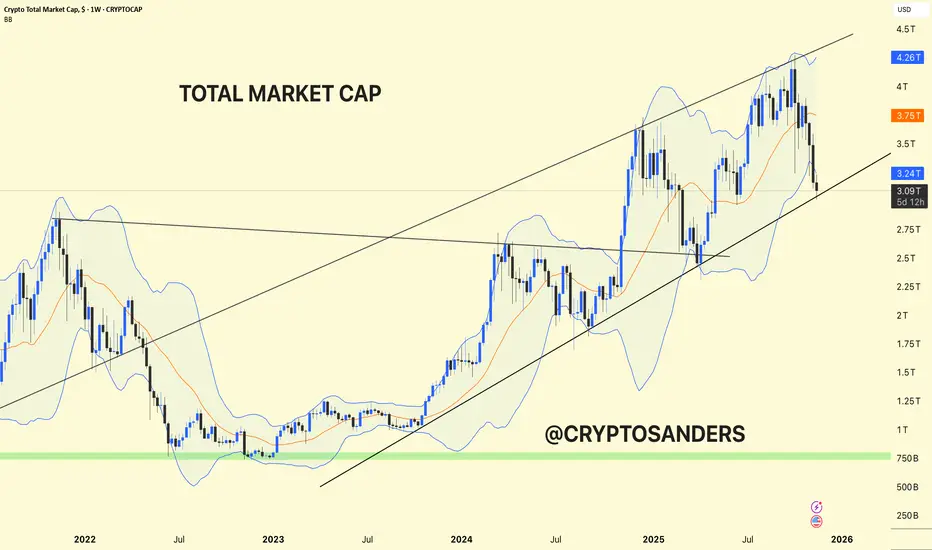
The entire crypto market cap is trading within a large ascending channel, keeping the long-term uptrend intact.
Recent Action: After making new highs above $4 trillion, the market has corrected sharply, pulling back to the channel's lower support around $3 trillion USD. This area is a historic pivot and should act as strong support if bulls remain in control.
Upper channel resistance is near $4.4T.
Major horizontal support is well below, near $800B (green zone), but the current structure keeps the market safely above that.
A sustained break below the channel could lead to deeper retracement, while a bullish hold here sets up for another rally.
Holding this channel support can produce a recovery phase, targeting previous highs and new all-time highs.
Losing this support could trigger broader risk-off sentiment and test much lower ranges.
The crypto market is at a critical inflection—channel support is being tested after a steep correction. Staying above $3T maintains the bullish structure. Watch for a decisive bounce or breakdown in the coming weeks.
DYOR | NFA

관련 발행물
면책사항
해당 정보와 게시물은 금융, 투자, 트레이딩 또는 기타 유형의 조언이나 권장 사항으로 간주되지 않으며, 트레이딩뷰에서 제공하거나 보증하는 것이 아닙니다. 자세한 내용은 이용 약관을 참조하세요.
관련 발행물
면책사항
해당 정보와 게시물은 금융, 투자, 트레이딩 또는 기타 유형의 조언이나 권장 사항으로 간주되지 않으며, 트레이딩뷰에서 제공하거나 보증하는 것이 아닙니다. 자세한 내용은 이용 약관을 참조하세요.