
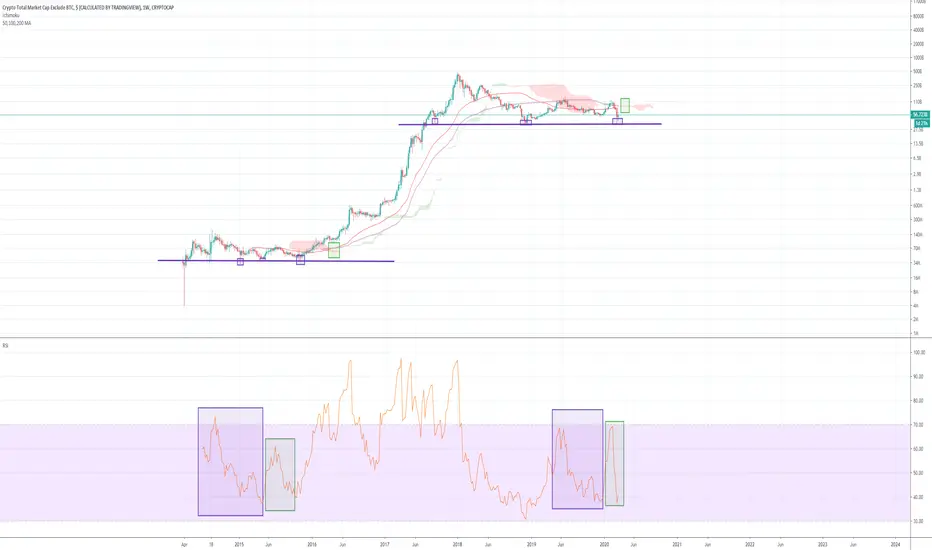
Impending golden cross on the weekly chart for the alt coin market cap! Also included a few points (purple squares) that show similarities to the previous bull run, and a RSI fractal i'm not sure if that's a thing? I know its meant to be used just for divergences but i noticed some similarities and thought i'd share. Ichimoku resistance can also be seen to be thinning which is a good sign for the golden cross. Happy trading in this crazy market!

면책사항
해당 정보와 게시물은 금융, 투자, 트레이딩 또는 기타 유형의 조언이나 권장 사항으로 간주되지 않으며, 트레이딩뷰에서 제공하거나 보증하는 것이 아닙니다. 자세한 내용은 이용 약관을 참조하세요.
면책사항
해당 정보와 게시물은 금융, 투자, 트레이딩 또는 기타 유형의 조언이나 권장 사항으로 간주되지 않으며, 트레이딩뷰에서 제공하거나 보증하는 것이 아닙니다. 자세한 내용은 이용 약관을 참조하세요.