
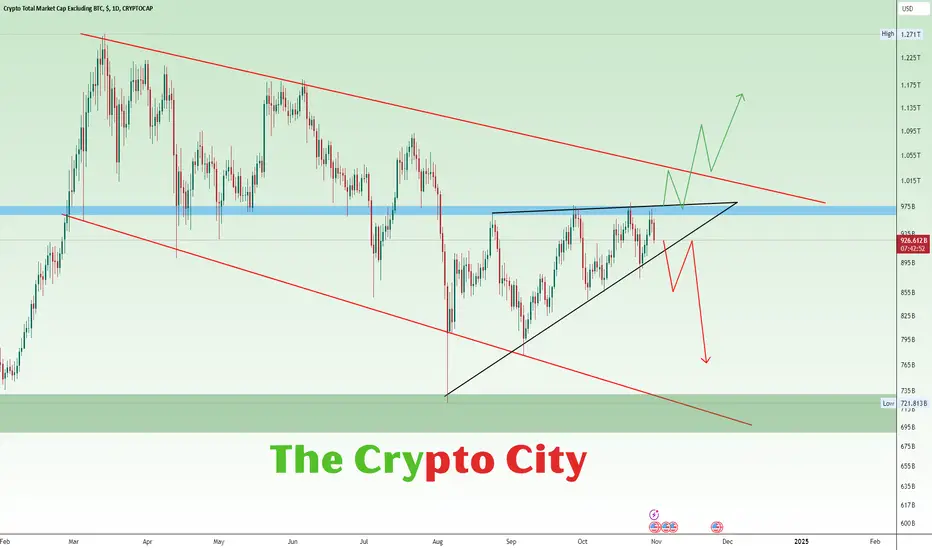
This chart of the total crypto market cap (excluding BTC) shows a symmetrical triangle pattern within a broader descending wedge. Price is near the triangle’s upper resistance, suggesting a potential breakout or breakdown. The Blue resistance zone is very important to flip for bullish moves.
Everything is on the chart
Everything is on the chart

면책사항
해당 정보와 게시물은 금융, 투자, 트레이딩 또는 기타 유형의 조언이나 권장 사항으로 간주되지 않으며, 트레이딩뷰에서 제공하거나 보증하는 것이 아닙니다. 자세한 내용은 이용 약관을 참조하세요.
면책사항
해당 정보와 게시물은 금융, 투자, 트레이딩 또는 기타 유형의 조언이나 권장 사항으로 간주되지 않으며, 트레이딩뷰에서 제공하거나 보증하는 것이 아닙니다. 자세한 내용은 이용 약관을 참조하세요.