
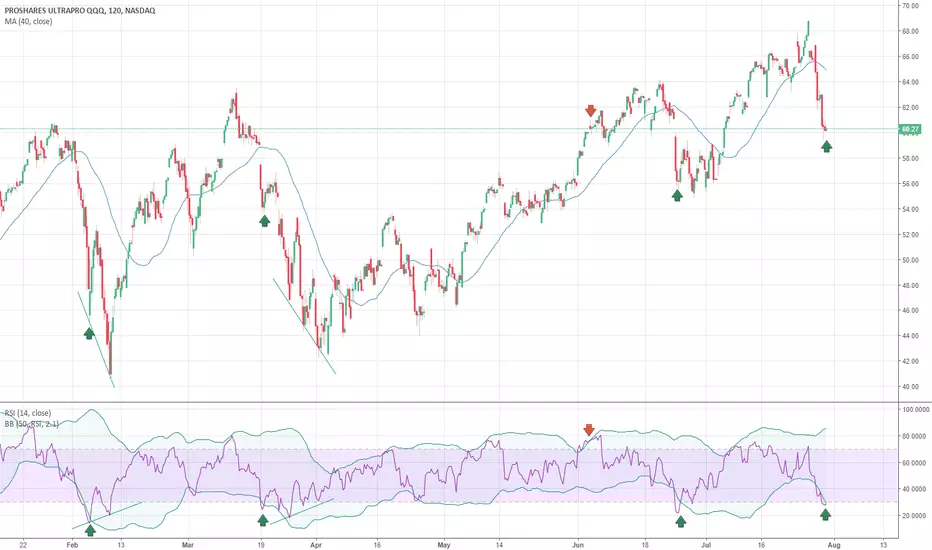
Nasdaq 100 is looking oversold after a bad week for tech. However, after a big selloff the RSI over multiple time frames shows oversold levels. On top of being below the standard 30 level, the RSI dips below the lower adjusted (50 period, 2.1 standard deviations) bollinger band for a more accurate reading of oversold. Over the past 6-months, the combination of the RSI dip below 30 and a dip below the lower band has been an excellent buy signal. Tech isn't going away anytime soon...

면책사항
해당 정보와 게시물은 금융, 투자, 트레이딩 또는 기타 유형의 조언이나 권장 사항으로 간주되지 않으며, 트레이딩뷰에서 제공하거나 보증하는 것이 아닙니다. 자세한 내용은 이용 약관을 참조하세요.
면책사항
해당 정보와 게시물은 금융, 투자, 트레이딩 또는 기타 유형의 조언이나 권장 사항으로 간주되지 않으며, 트레이딩뷰에서 제공하거나 보증하는 것이 아닙니다. 자세한 내용은 이용 약관을 참조하세요.