
Fundamental Overview of TRUMP/USDT:
Official Trump Coin (TRUMP) has gained attention due to its association with former President Donald Trump. With a current price of $11.86 and a market capitalization of approximately $2.37 billion, TRUMP ranks among the notable digital assets in the market. (coinmarketcap.com) Its popularity and volatility attract both investors and traders seeking new opportunities.
Technical Analysis:
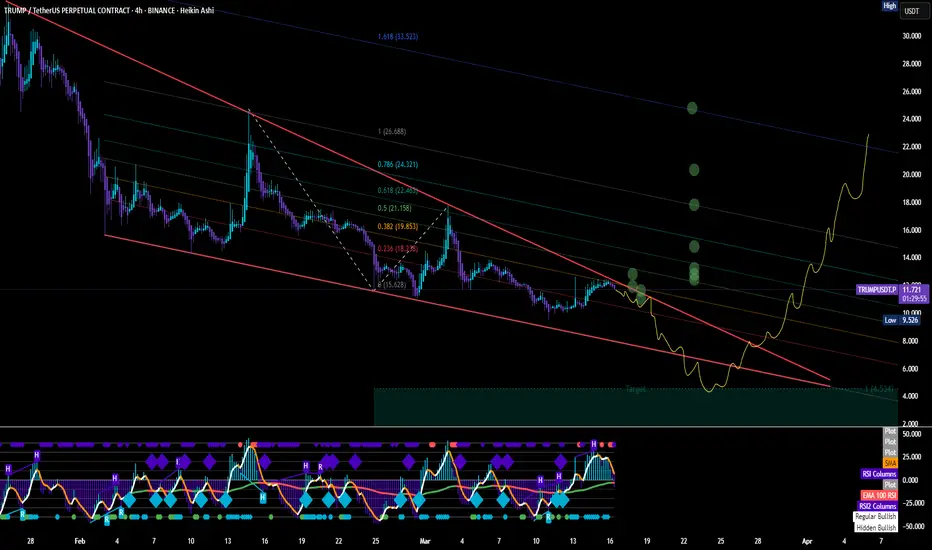
We see that TRUMP coin is currently trading within a descending channel, respecting two trendlines that form a falling wedge pattern. If the downward momentum persists, we expect the price to drop into the $4.5-$5.0 range, where we anticipate strong buying pressure to emerge.
Key VWAP levels, highlighted with green circles, act as price magnets, making them crucial points of interest for a potential reversal. Additionally, Fibonacci retracement levels indicate significant resistance around $21.15 (0.618 Fib) and $24.22 (0.786 Fib), which could serve as key breakout targets if the price initiates an upward move.
If the price successfully reclaims these resistance levels, a bullish scenario could unfold, potentially targeting $30+ in the mid-term. However, failure to hold support around $4.5-$5.0 could lead to further downside exploration.
Official Trump Coin (TRUMP) has gained attention due to its association with former President Donald Trump. With a current price of $11.86 and a market capitalization of approximately $2.37 billion, TRUMP ranks among the notable digital assets in the market. (coinmarketcap.com) Its popularity and volatility attract both investors and traders seeking new opportunities.
Technical Analysis:
We see that TRUMP coin is currently trading within a descending channel, respecting two trendlines that form a falling wedge pattern. If the downward momentum persists, we expect the price to drop into the $4.5-$5.0 range, where we anticipate strong buying pressure to emerge.
Key VWAP levels, highlighted with green circles, act as price magnets, making them crucial points of interest for a potential reversal. Additionally, Fibonacci retracement levels indicate significant resistance around $21.15 (0.618 Fib) and $24.22 (0.786 Fib), which could serve as key breakout targets if the price initiates an upward move.
If the price successfully reclaims these resistance levels, a bullish scenario could unfold, potentially targeting $30+ in the mid-term. However, failure to hold support around $4.5-$5.0 could lead to further downside exploration.

면책사항
해당 정보와 게시물은 금융, 투자, 트레이딩 또는 기타 유형의 조언이나 권장 사항으로 간주되지 않으며, 트레이딩뷰에서 제공하거나 보증하는 것이 아닙니다. 자세한 내용은 이용 약관을 참조하세요.
면책사항
해당 정보와 게시물은 금융, 투자, 트레이딩 또는 기타 유형의 조언이나 권장 사항으로 간주되지 않으며, 트레이딩뷰에서 제공하거나 보증하는 것이 아닙니다. 자세한 내용은 이용 약관을 참조하세요.