
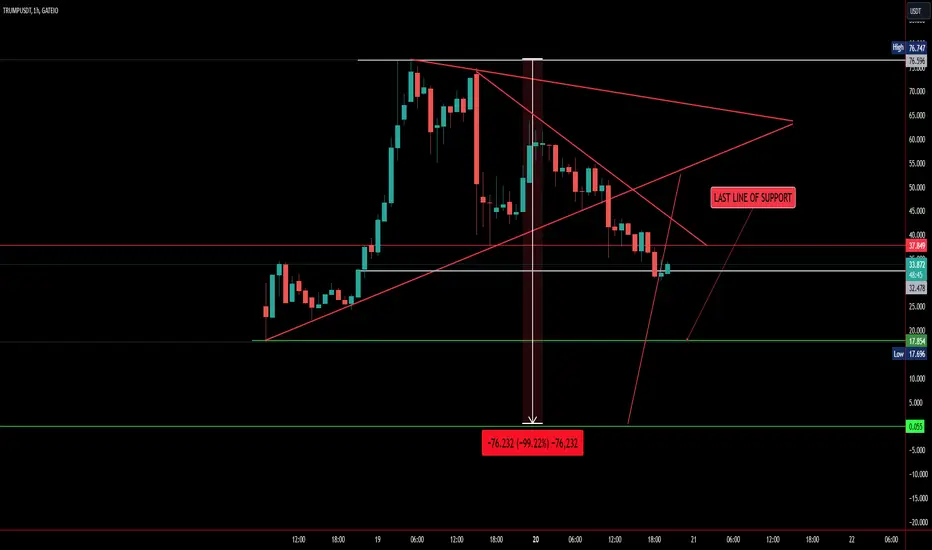
TRUMPUSDT recently broke out downwards from a symmetrical triangle on the 1-hour chart, signaling potential bearish momentum.
❃The triangle had converging trendlines, indicating market indecision.
❃The breakdown below the lower trendline suggests further downside potential, with $17.854 USDT as the key support level.
❃If the support fails, the price could test lower levels, potentially near 0.055 USDT.
Watch for continued bearish momentum and volume increases as confirmation. If price recovers, resistance is around $40 USDT.
❃The triangle had converging trendlines, indicating market indecision.
❃The breakdown below the lower trendline suggests further downside potential, with $17.854 USDT as the key support level.
❃If the support fails, the price could test lower levels, potentially near 0.055 USDT.
Watch for continued bearish momentum and volume increases as confirmation. If price recovers, resistance is around $40 USDT.

관련 발행물
면책사항
해당 정보와 게시물은 금융, 투자, 트레이딩 또는 기타 유형의 조언이나 권장 사항으로 간주되지 않으며, 트레이딩뷰에서 제공하거나 보증하는 것이 아닙니다. 자세한 내용은 이용 약관을 참조하세요.
면책사항
해당 정보와 게시물은 금융, 투자, 트레이딩 또는 기타 유형의 조언이나 권장 사항으로 간주되지 않으며, 트레이딩뷰에서 제공하거나 보증하는 것이 아닙니다. 자세한 내용은 이용 약관을 참조하세요.