
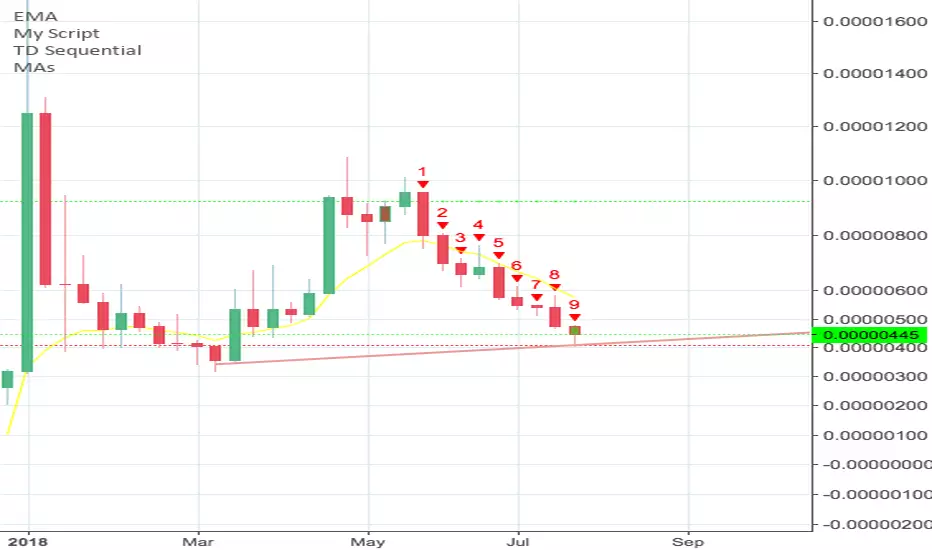
According to the 'Weekly' chart of Tron (TRX), using the TD-Sequential system, we are on a red '9' of '9', which means a correction or reversal is more than likely about to occur after the closing this current '9' candle.
With the launch of Tron's Mainnet, its my belief that a bull-run is around the corner.
I'm not a financial advisor, but I'm long on Tron.
Good luck if you enter this trade!
With the launch of Tron's Mainnet, its my belief that a bull-run is around the corner.
I'm not a financial advisor, but I'm long on Tron.
Good luck if you enter this trade!
노트
Looking at the 'Weekly' chart below: Using the TD-Sequential indicator system, It looks like the red '9' candle gave us a beautiful "Reversal" candle.I believe the blue line with the arrow will act as a support line for TRX. I'm also using a 100-day SMA (Simple Moving Average)
WEEKLY CHART:
Now let's take a look at the daily chart below: As you can see, we had a very bullish-run in late March and the month of April. We've now been in a declining, bearish market since the beginning of June.
We really can't tell much from looking at the 'daily' chart; However, we are on a green '2' of '9' candle. One more thing to note about this daily chart is the 20-day SMA has been a great Support and Resistance line in the past.
DAILY CHART:

면책사항
해당 정보와 게시물은 금융, 투자, 트레이딩 또는 기타 유형의 조언이나 권장 사항으로 간주되지 않으며, 트레이딩뷰에서 제공하거나 보증하는 것이 아닙니다. 자세한 내용은 이용 약관을 참조하세요.
면책사항
해당 정보와 게시물은 금융, 투자, 트레이딩 또는 기타 유형의 조언이나 권장 사항으로 간주되지 않으며, 트레이딩뷰에서 제공하거나 보증하는 것이 아닙니다. 자세한 내용은 이용 약관을 참조하세요.