
Analysis on the Hourly:
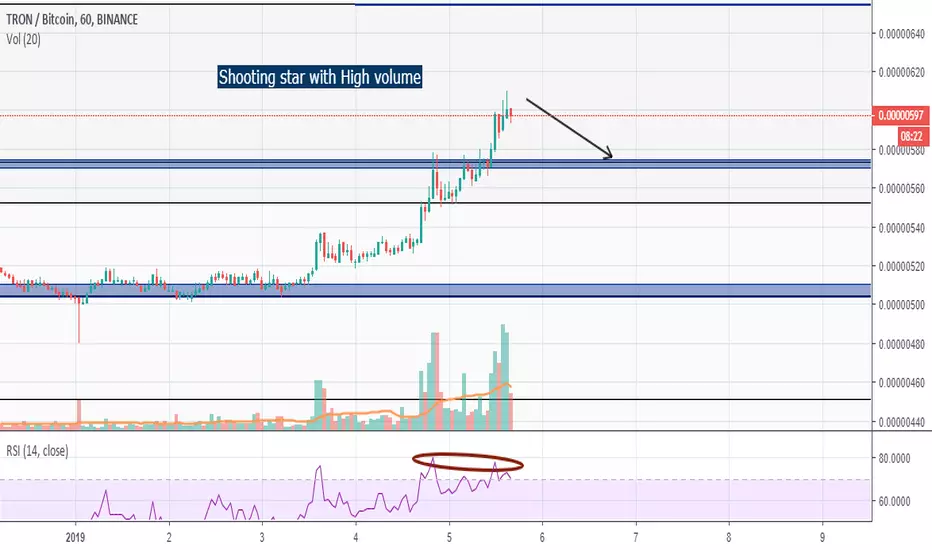
Here we can see a shooting star formed with high volume, this indicates that a lot of selling was done at this point.
If we watch the rsi closely, it formed a double top, which indicates going down.
Now there's two possibilities:
1) Either it keeps going up and touches 652-655 (Fibonacci cluster) ,
2) Or we have a short-term correction to the 570-575.
If 2) occurs, we need to watch that level closely, and find a bullish candle with good volume in order to enter a possible trade to 652-655.
Also, keep in mind that in the 4 hour timeframe, if it forms a hanging man, most likely 2) will occur.
I will keep updating!
If you want to share your ideas , comment down below and like if you enjoyed this analysis.
Here we can see a shooting star formed with high volume, this indicates that a lot of selling was done at this point.
If we watch the rsi closely, it formed a double top, which indicates going down.
Now there's two possibilities:
1) Either it keeps going up and touches 652-655 (Fibonacci cluster) ,
2) Or we have a short-term correction to the 570-575.
If 2) occurs, we need to watch that level closely, and find a bullish candle with good volume in order to enter a possible trade to 652-655.
Also, keep in mind that in the 4 hour timeframe, if it forms a hanging man, most likely 2) will occur.
I will keep updating!
If you want to share your ideas , comment down below and like if you enjoyed this analysis.
노트
It did the second possibility and rebounded in the fibonacci cluster as predicted거래청산: 타겟 닿음
As told in the analysis, it touched our take profit of 652-655.I will post a new chart if anymore trading opportunities occur.

면책사항
해당 정보와 게시물은 금융, 투자, 트레이딩 또는 기타 유형의 조언이나 권장 사항으로 간주되지 않으며, 트레이딩뷰에서 제공하거나 보증하는 것이 아닙니다. 자세한 내용은 이용 약관을 참조하세요.
면책사항
해당 정보와 게시물은 금융, 투자, 트레이딩 또는 기타 유형의 조언이나 권장 사항으로 간주되지 않으며, 트레이딩뷰에서 제공하거나 보증하는 것이 아닙니다. 자세한 내용은 이용 약관을 참조하세요.