
What's up Guys , in this analysis I gonna talk about TRX
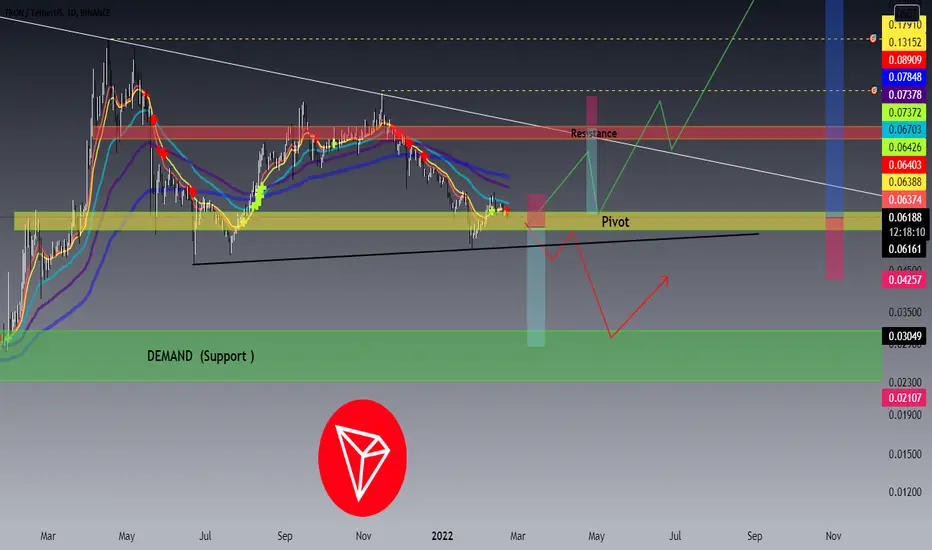
As you can see in the daily and weekly time frame for pair of TRX/USDT ,since 16 April it has been declining after recording new ATH about 0.18$ ,
and now we can see that TRX is compressing in an descending or symmetrical triangle pattern ,
also there is a possibility of further fall right now bcs of crossing under of emas ,
and now It is trading above pivot zone and if break out this current zone in can go down to lower support and Demand area ,
meanwhile it has reached the bottom of triangle again and can have a jump again ,
by breakout of descending trend line , there is a high possibility to reach the targets respectively and seeing new ATH in the long-term .
so in this case it can continue its rally by closing above resistance range and have a pulback and continue .
🛑resistances: $0.099-0.107///descending trendline
🆚pivot zone: $0.057-0.064$
❇️supports: $0.012345-$0.03142 ////ascending trendline
--------------------------------------------------------------------------------------------------------------------
👉This analysis is my personal opinion ,not a financial advice ,so do your own research.
💜 if you're a fan of my analyses PLZ follow me and give a big thumbs 👍 OR drop comment 🗯💭
노트
trxusdt ( weekly time frame ):
관련 발행물
면책사항
해당 정보와 게시물은 금융, 투자, 트레이딩 또는 기타 유형의 조언이나 권장 사항으로 간주되지 않으며, 트레이딩뷰에서 제공하거나 보증하는 것이 아닙니다. 자세한 내용은 이용 약관을 참조하세요.
면책사항
해당 정보와 게시물은 금융, 투자, 트레이딩 또는 기타 유형의 조언이나 권장 사항으로 간주되지 않으며, 트레이딩뷰에서 제공하거나 보증하는 것이 아닙니다. 자세한 내용은 이용 약관을 참조하세요.