
Hello people,
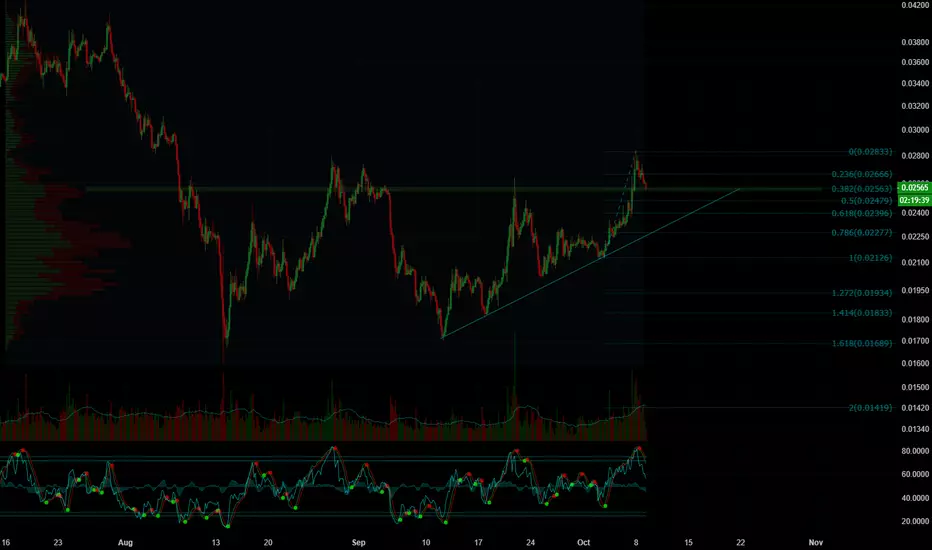
As we can see on the chart, TRX had a massive bullish impulse, but again got rejected from the same resistance.
We can see the picture more clearly on the daily time chart:

Current price is testing 0.382 Fibonacci retracements of the last bullish impulse. This level is also important because it was the last higher high TRON managed to break on a smaller timeframe. If the bulls manage to hold these prices we can soon expect another attempt towards higher high on daily. This scenario would be very bullish.
On TRX/BTC chart TRON looks very good:

It broke massively from the iH&S structure and is now retesting the neckline. If the bulls manage to hold that support line we can expect a huge move to the upside:

Be patient and trade safely.
As we can see on the chart, TRX had a massive bullish impulse, but again got rejected from the same resistance.
We can see the picture more clearly on the daily time chart:
Current price is testing 0.382 Fibonacci retracements of the last bullish impulse. This level is also important because it was the last higher high TRON managed to break on a smaller timeframe. If the bulls manage to hold these prices we can soon expect another attempt towards higher high on daily. This scenario would be very bullish.
On TRX/BTC chart TRON looks very good:
It broke massively from the iH&S structure and is now retesting the neckline. If the bulls manage to hold that support line we can expect a huge move to the upside:
Be patient and trade safely.

면책사항
해당 정보와 게시물은 금융, 투자, 트레이딩 또는 기타 유형의 조언이나 권장 사항으로 간주되지 않으며, 트레이딩뷰에서 제공하거나 보증하는 것이 아닙니다. 자세한 내용은 이용 약관을 참조하세요.
면책사항
해당 정보와 게시물은 금융, 투자, 트레이딩 또는 기타 유형의 조언이나 권장 사항으로 간주되지 않으며, 트레이딩뷰에서 제공하거나 보증하는 것이 아닙니다. 자세한 내용은 이용 약관을 참조하세요.