
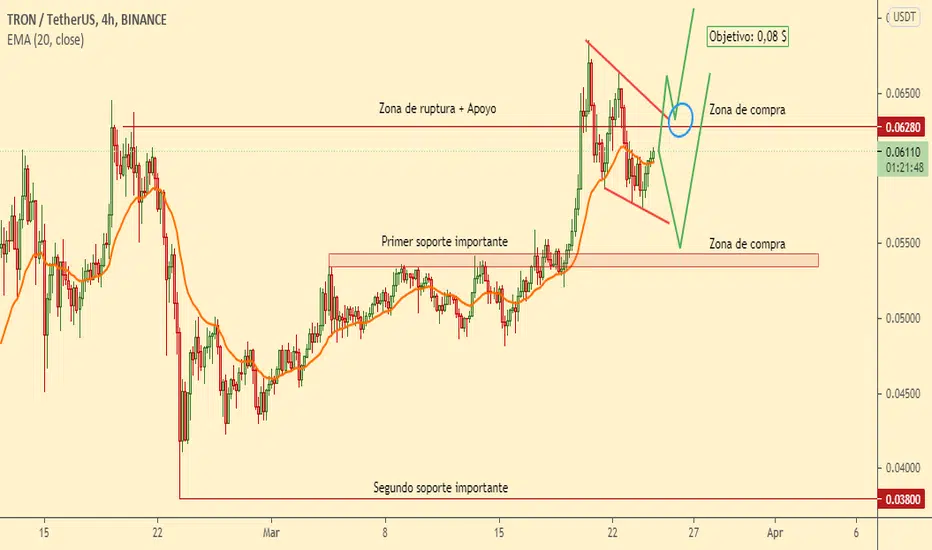
On the 240 min trx chart we see how the price is leaving a possible continuation pattern + resistance zone breakout.
- SCENARIO 1: We wait for the price to break the bullish pennant figure to position ourselves for a retracement to the upper divergence.
- SCENARIO 2: We wait for the price to retrace to the support zone and leave us a pattern of rising highs and rising lows to join the price.
----------------------------------------------------------------
En el gráfico de 240 min de trx vemos como el precio está dejando un posible patrón de continuación + ruptura de zona de resistencia.
- ESCENARIO 1: Esperamos a que el precio rompa la figura de banderín alcista para posicionarnos en un retroceso a la divergencia superior.
- ESCENARIO 2: Esperamos a que el precio retroceda a la zona de soporte y que nos deje un patrón de máximos y mínimos crecientes para incorporarnos.
- SCENARIO 1: We wait for the price to break the bullish pennant figure to position ourselves for a retracement to the upper divergence.
- SCENARIO 2: We wait for the price to retrace to the support zone and leave us a pattern of rising highs and rising lows to join the price.
----------------------------------------------------------------
En el gráfico de 240 min de trx vemos como el precio está dejando un posible patrón de continuación + ruptura de zona de resistencia.
- ESCENARIO 1: Esperamos a que el precio rompa la figura de banderín alcista para posicionarnos en un retroceso a la divergencia superior.
- ESCENARIO 2: Esperamos a que el precio retroceda a la zona de soporte y que nos deje un patrón de máximos y mínimos crecientes para incorporarnos.

면책사항
해당 정보와 게시물은 금융, 투자, 트레이딩 또는 기타 유형의 조언이나 권장 사항으로 간주되지 않으며, 트레이딩뷰에서 제공하거나 보증하는 것이 아닙니다. 자세한 내용은 이용 약관을 참조하세요.
면책사항
해당 정보와 게시물은 금융, 투자, 트레이딩 또는 기타 유형의 조언이나 권장 사항으로 간주되지 않으며, 트레이딩뷰에서 제공하거나 보증하는 것이 아닙니다. 자세한 내용은 이용 약관을 참조하세요.