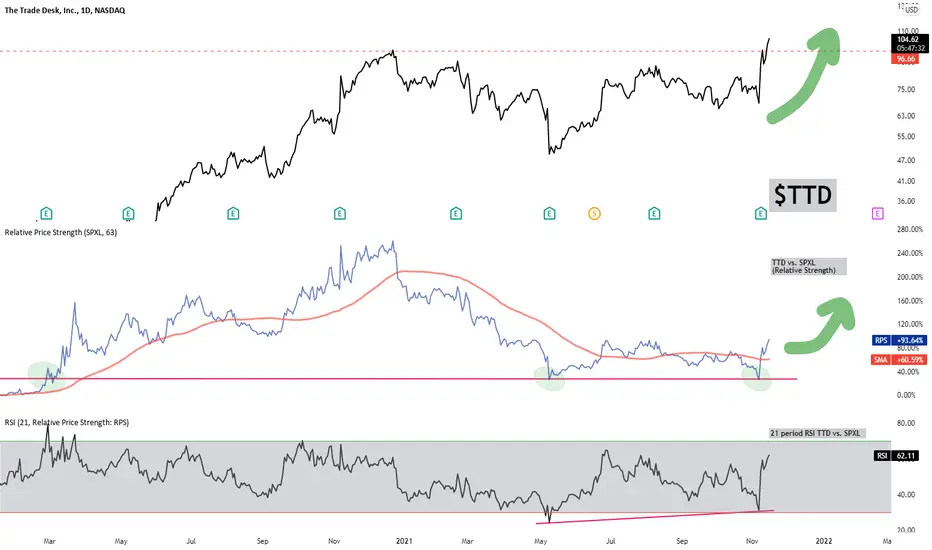
This is a great example of a favorite chart construct of mine. Regardless of the ticker (although I do favor  TTD) I find this chart construction to be very beneficial to keeping things simple, effective and efficient. The following are key takeaways...
dgorghuber (TV)
@Futures_Runner (Twitter)
TTD) I find this chart construction to be very beneficial to keeping things simple, effective and efficient. The following are key takeaways...- Top third - Current price, line chart - looking for absolute support/resistance, uptrending/downtrending specifics. --->>> K.I.S.S. mentality here.
- Middle third - Price of underlying vs.
 SPXL (in this case) - Relative strength of the underlying security vs. SPXL gives a great shot of whether or not I even need to be considering a specific holding over $SPXL. I also show the 63 day SMA on this ratio chart.
- Bottom third - RSI of the RS chart (middle third) - the goal here is to look for trending momentum either up or down as well as spotting critical divergences. I find divergences of this magnitude to be more reliable (tradeable) than your average price of underlying divergence. Shown is an example with $TTD..
dgorghuber (TV)
@Futures_Runner (Twitter)

Dan J. Gorghuber, CMT
면책사항
해당 정보와 게시물은 금융, 투자, 트레이딩 또는 기타 유형의 조언이나 권장 사항으로 간주되지 않으며, 트레이딩뷰에서 제공하거나 보증하는 것이 아닙니다. 자세한 내용은 이용 약관을 참조하세요.
Dan J. Gorghuber, CMT
면책사항
해당 정보와 게시물은 금융, 투자, 트레이딩 또는 기타 유형의 조언이나 권장 사항으로 간주되지 않으며, 트레이딩뷰에서 제공하거나 보증하는 것이 아닙니다. 자세한 내용은 이용 약관을 참조하세요.