
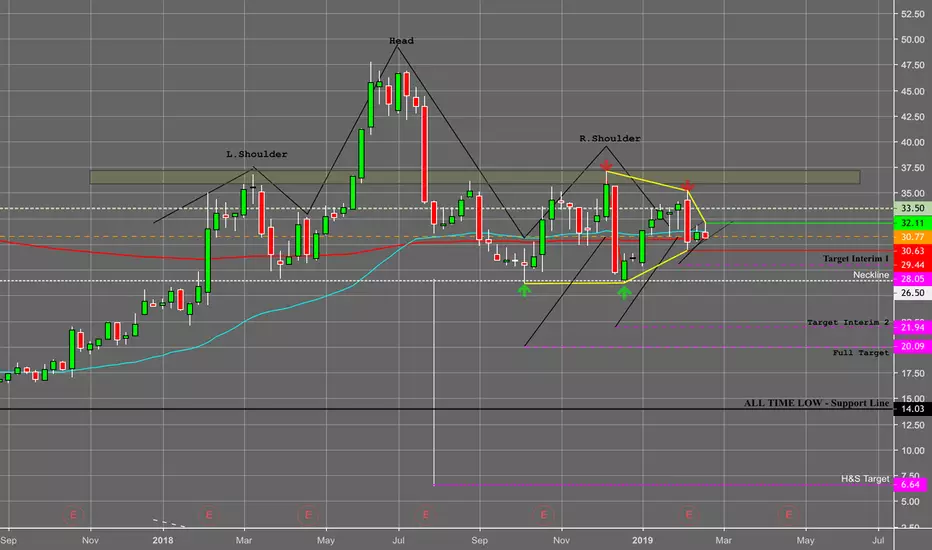
Twitter has been setting up a couple pretty strong bear patterns.
There is a nice forming H&S pattern with the right shoulder forming a low slung triangle pattern with the down-leg candles strong the the up-leg for the triangle and also the H&S pattern.
Moving averages has also decided to cross bearish with price action showing below it. The 100 EMA on the week looks to be the only support looking to support Twitter which happens to be around the red line drawn. Might have a little support from that. Once that breaks, no real strong support until
about $14 (All time low)
Possible short @ $29.44
Stop Loss $32.11
Taking most profit around Int 2.
There is a nice forming H&S pattern with the right shoulder forming a low slung triangle pattern with the down-leg candles strong the the up-leg for the triangle and also the H&S pattern.
Moving averages has also decided to cross bearish with price action showing below it. The 100 EMA on the week looks to be the only support looking to support Twitter which happens to be around the red line drawn. Might have a little support from that. Once that breaks, no real strong support until
about $14 (All time low)
Possible short @ $29.44
Stop Loss $32.11
Taking most profit around Int 2.
매매 수동청산
This has negated the H&S theory I had for this trend and is showing strength. Tech sector looks fairly strong
면책사항
해당 정보와 게시물은 금융, 투자, 트레이딩 또는 기타 유형의 조언이나 권장 사항으로 간주되지 않으며, 트레이딩뷰에서 제공하거나 보증하는 것이 아닙니다. 자세한 내용은 이용 약관을 참조하세요.
면책사항
해당 정보와 게시물은 금융, 투자, 트레이딩 또는 기타 유형의 조언이나 권장 사항으로 간주되지 않으며, 트레이딩뷰에서 제공하거나 보증하는 것이 아닙니다. 자세한 내용은 이용 약관을 참조하세요.