
Hello Crypto Lovers,
Mars Signals team wishes you high profits.
This is a one-day-time frame analysis for TWTUSDT
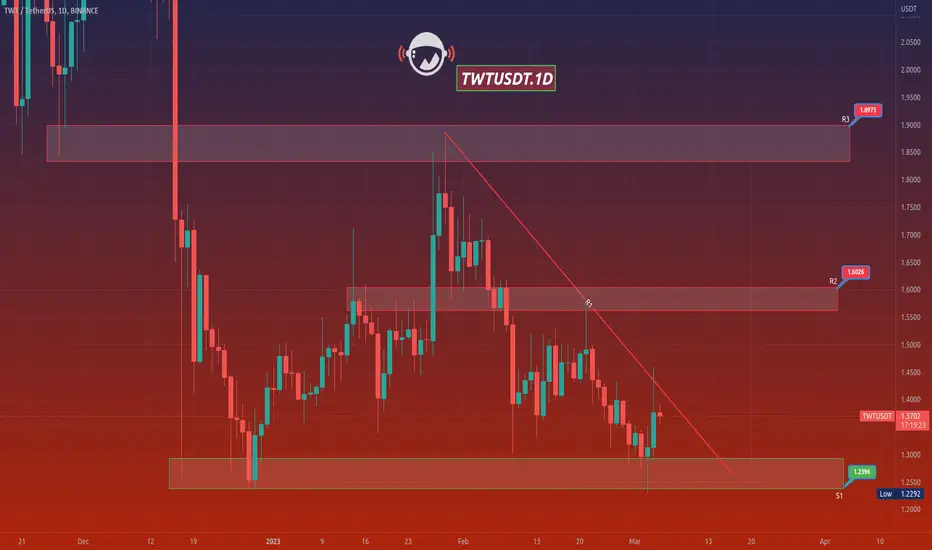
R3, on the top, used to be a support area. R1 and R2 in this chart are our resistance areas and include the disability of the price to rise. And we have S1 which is a long-term support area at the bottom of the chart with its well support of price at different points. Presently, we see the price is on a rising trend when it was supported at S1 and this rise would continue up to R1; which shows its fluctuation below this point. We believe it would have more rise through providing us some rising signs and more increase will take place toward R2. If the price is rejected at any points, it faces a decline down to our support area. But in case the price is able to fix itself over R2, then more rise would be there for it and R2 would be a suitable point for saving profits. Keep in mind that by the time the price is not supported and falls below S1 area, more fall will happen to it; which is not possible now. The point is that if you are looking for wise trades and less risky ones, our suggestion will be following our regular updates all the time.
Warning: This is just a suggestion and we do not guarantee profits. We advise you to analyze the chart before opening any positions.
Wish you luck
Mars Signals team wishes you high profits.
This is a one-day-time frame analysis for TWTUSDT
R3, on the top, used to be a support area. R1 and R2 in this chart are our resistance areas and include the disability of the price to rise. And we have S1 which is a long-term support area at the bottom of the chart with its well support of price at different points. Presently, we see the price is on a rising trend when it was supported at S1 and this rise would continue up to R1; which shows its fluctuation below this point. We believe it would have more rise through providing us some rising signs and more increase will take place toward R2. If the price is rejected at any points, it faces a decline down to our support area. But in case the price is able to fix itself over R2, then more rise would be there for it and R2 would be a suitable point for saving profits. Keep in mind that by the time the price is not supported and falls below S1 area, more fall will happen to it; which is not possible now. The point is that if you are looking for wise trades and less risky ones, our suggestion will be following our regular updates all the time.
Warning: This is just a suggestion and we do not guarantee profits. We advise you to analyze the chart before opening any positions.
Wish you luck

면책사항
해당 정보와 게시물은 금융, 투자, 트레이딩 또는 기타 유형의 조언이나 권장 사항으로 간주되지 않으며, 트레이딩뷰에서 제공하거나 보증하는 것이 아닙니다. 자세한 내용은 이용 약관을 참조하세요.
면책사항
해당 정보와 게시물은 금융, 투자, 트레이딩 또는 기타 유형의 조언이나 권장 사항으로 간주되지 않으며, 트레이딩뷰에서 제공하거나 보증하는 것이 아닙니다. 자세한 내용은 이용 약관을 참조하세요.