Price and Indicator Analysis
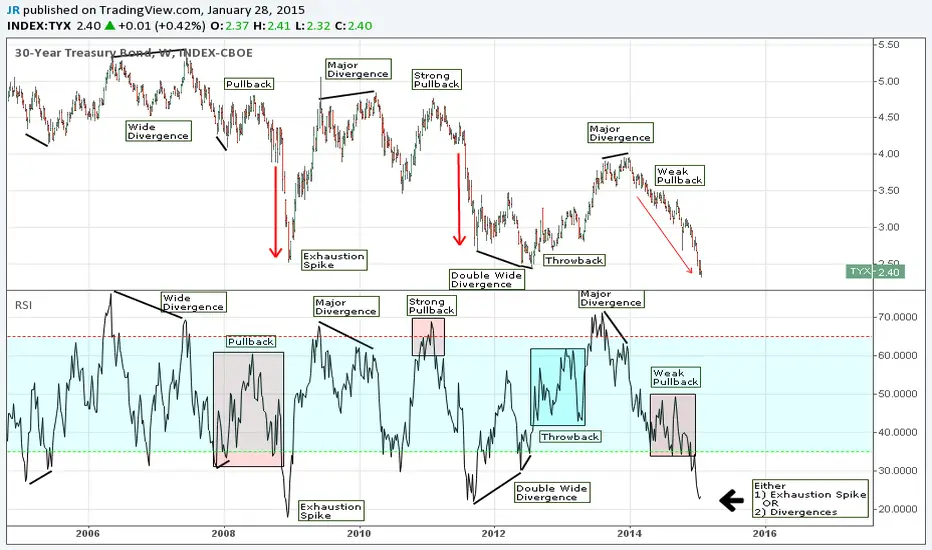
In this chart I used US 30 Year Treasuries weekly chart to explain how price and indicator analysis work.
I cover the basis of divergences, pullbacks, throwbacks, and exhaustion spikes.
Pullbacks (red) are seen when price and indicators such as RSI have diverged for a great length (wide divergence) or when you have weak divergence top comparing price and RSI. Throwbacks (blue) have the same effect, however show up when you have a bottom divergence or exhaustion spike.
If you notice wide divergence tops or bottoms more than often develop a stagnant price pullback/throwback. This is important to understand for timing purposes with instruments such as options.
When you have a weak major divergence top or bottom, there is usually a strong pullback/throwback occasionally surpassing the original price top / bottom.
Exhaustion spikes often happen after strong pullbacks and pullbacks that price sideways for a long duration. Exhaustion spikes are difficult to call bottoms or tops because they can lead to large price moves. To find an exhaustion bottom it is best to look on a much smaller time frame for strong angle divergences.
For TYX I am waiting to see a rapid price movement to the downside or a divergence signal with a lower bottom in price and a rising divergence indication.
I cover the basis of divergences, pullbacks, throwbacks, and exhaustion spikes.
Pullbacks (red) are seen when price and indicators such as RSI have diverged for a great length (wide divergence) or when you have weak divergence top comparing price and RSI. Throwbacks (blue) have the same effect, however show up when you have a bottom divergence or exhaustion spike.
If you notice wide divergence tops or bottoms more than often develop a stagnant price pullback/throwback. This is important to understand for timing purposes with instruments such as options.
When you have a weak major divergence top or bottom, there is usually a strong pullback/throwback occasionally surpassing the original price top / bottom.
Exhaustion spikes often happen after strong pullbacks and pullbacks that price sideways for a long duration. Exhaustion spikes are difficult to call bottoms or tops because they can lead to large price moves. To find an exhaustion bottom it is best to look on a much smaller time frame for strong angle divergences.
For TYX I am waiting to see a rapid price movement to the downside or a divergence signal with a lower bottom in price and a rising divergence indication.

면책사항
해당 정보와 게시물은 금융, 투자, 트레이딩 또는 기타 유형의 조언이나 권장 사항으로 간주되지 않으며, 트레이딩뷰에서 제공하거나 보증하는 것이 아닙니다. 자세한 내용은 이용 약관을 참조하세요.
면책사항
해당 정보와 게시물은 금융, 투자, 트레이딩 또는 기타 유형의 조언이나 권장 사항으로 간주되지 않으며, 트레이딩뷰에서 제공하거나 보증하는 것이 아닙니다. 자세한 내용은 이용 약관을 참조하세요.