
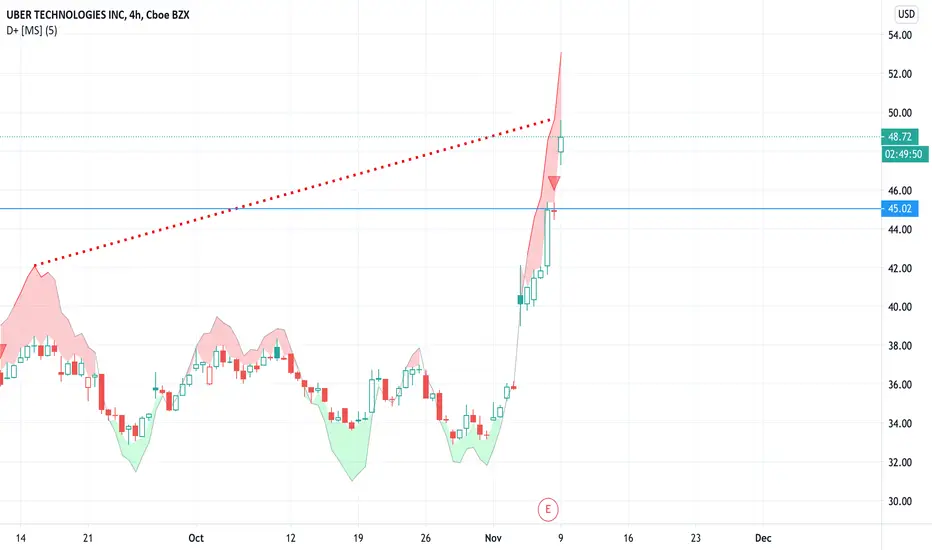
This chart is free of clutter, I would just like to show the sell signal on the 4Hr. I have purchased 75 contracts for UBER to hit $45 a share by next Friday. If it hits that strike price at any point between now and then I will be selling my position.
This is not just a single sell signal, there are many sell signals on every chart from the 1min to the 4hr and Bollinger Bands are giving sell signals on every time frame as well. With an extremely high RSI we can expect UBER to drop.
This is not just a single sell signal, there are many sell signals on every chart from the 1min to the 4hr and Bollinger Bands are giving sell signals on every time frame as well. With an extremely high RSI we can expect UBER to drop.

면책사항
해당 정보와 게시물은 금융, 투자, 트레이딩 또는 기타 유형의 조언이나 권장 사항으로 간주되지 않으며, 트레이딩뷰에서 제공하거나 보증하는 것이 아닙니다. 자세한 내용은 이용 약관을 참조하세요.
면책사항
해당 정보와 게시물은 금융, 투자, 트레이딩 또는 기타 유형의 조언이나 권장 사항으로 간주되지 않으며, 트레이딩뷰에서 제공하거나 보증하는 것이 아닙니다. 자세한 내용은 이용 약관을 참조하세요.