Friends,
Oil has been in a downfall over the past several weeks, based on a variety of fundamental opinions, be it geo-strategically, cyclically or economically driven.
GEOMETRY:
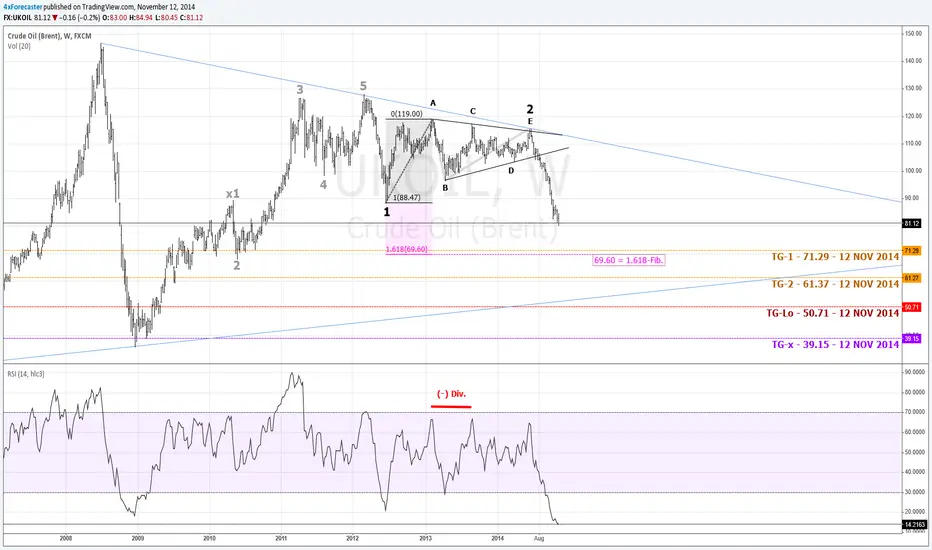
Technically speaking, since mid-July 2014, price resolved itself out of a geometry following a protracted sideways defined by the A-B-C-D-E points. From July 14th to August 04th, price coiled about the lower border of that geometry, and since fell in a consistent angle with no interim rallies.
ELLIOTT WAVE:
This straight, near linear fall is reminiscent of an Elliott Wave core impulsive move, typical of its internal Wave-3, thus suggesting that the prior triangle that held price into suspension over several months was likely the unfolding of a preceding Wave-1 and Wave-2.
FIBONACCI:
From a standard 1.618-Fibonacci extension, then a mere projection using Wave-1 and Wave-2 as anchors would define a possible support at:
(Wave-1 / Wave-2) x 1.618-Fib = 69.60.
This level gains credence on the basis that:
1 - It aligns with a historical support when a prior Wave-2 (grey shade to the left) offered support to a historical level via the intermediary of a Wave-3 impulse.
and
2 - It also aligns well with the predictive/forecasting model's first forecast, namely:
- TG-1 - 71.29 - 12 NOV 2014
PREDICTIVE/FORECASTING MODEL;
Looking at the entire predictive/forecasting model's targets, there are two NUMERICAL targets:
1 - TG-1 - 71.29 - 12 NOV 2014
and
2 - TG-2 - 61.37 - 12 NOV 2014,
as well as two NOMINAL targets:
1 - TG-Lo - 50.71 - 12 NOV 2014
and
2 - TG-x - 39.15 - 12 NOV 2014.
As explained in prior analyses/charts, the numerical targets offer a HIGHER probability of hit, but a lesser level of reversibility. This means that IF and ONCE hit, price will likely RETRACE in a Fibonacci order, between 0.382 and 0.618.
In contrast, the nominal targets offer a LESSER probability of hit. This means that if and once hit, price will likely REVERSE (and not just retrace) in a Fibonacci order that should exceed 0.618, and potentially attain extensions in the 1.131, 1.414, or 1.618 order.
OVERALL:
Trend is decisively bearish. Both Fibonacci measures and predictive/forecasting model have defined a nearby support level in the 69.60-to-71.29 range. However, on its own, the model suggest a potentially deeper attainment levels of diminishing probability, but increasing structural relevance.
Cheers,
David Alcindor
Predictive Analysis & Forecasting
Denver, Colorado - USA
----------
Twitter: 4xForecaster
----------
Oil has been in a downfall over the past several weeks, based on a variety of fundamental opinions, be it geo-strategically, cyclically or economically driven.
GEOMETRY:
Technically speaking, since mid-July 2014, price resolved itself out of a geometry following a protracted sideways defined by the A-B-C-D-E points. From July 14th to August 04th, price coiled about the lower border of that geometry, and since fell in a consistent angle with no interim rallies.
ELLIOTT WAVE:
This straight, near linear fall is reminiscent of an Elliott Wave core impulsive move, typical of its internal Wave-3, thus suggesting that the prior triangle that held price into suspension over several months was likely the unfolding of a preceding Wave-1 and Wave-2.
FIBONACCI:
From a standard 1.618-Fibonacci extension, then a mere projection using Wave-1 and Wave-2 as anchors would define a possible support at:
(Wave-1 / Wave-2) x 1.618-Fib = 69.60.
This level gains credence on the basis that:
1 - It aligns with a historical support when a prior Wave-2 (grey shade to the left) offered support to a historical level via the intermediary of a Wave-3 impulse.
and
2 - It also aligns well with the predictive/forecasting model's first forecast, namely:
- TG-1 - 71.29 - 12 NOV 2014
PREDICTIVE/FORECASTING MODEL;
Looking at the entire predictive/forecasting model's targets, there are two NUMERICAL targets:
1 - TG-1 - 71.29 - 12 NOV 2014
and
2 - TG-2 - 61.37 - 12 NOV 2014,
as well as two NOMINAL targets:
1 - TG-Lo - 50.71 - 12 NOV 2014
and
2 - TG-x - 39.15 - 12 NOV 2014.
As explained in prior analyses/charts, the numerical targets offer a HIGHER probability of hit, but a lesser level of reversibility. This means that IF and ONCE hit, price will likely RETRACE in a Fibonacci order, between 0.382 and 0.618.
In contrast, the nominal targets offer a LESSER probability of hit. This means that if and once hit, price will likely REVERSE (and not just retrace) in a Fibonacci order that should exceed 0.618, and potentially attain extensions in the 1.131, 1.414, or 1.618 order.
OVERALL:
Trend is decisively bearish. Both Fibonacci measures and predictive/forecasting model have defined a nearby support level in the 69.60-to-71.29 range. However, on its own, the model suggest a potentially deeper attainment levels of diminishing probability, but increasing structural relevance.
Cheers,
David Alcindor
Predictive Analysis & Forecasting
Denver, Colorado - USA
----------
Twitter: 4xForecaster
----------
노트
11 FEB 2016 - Chart Update:Here is to hitting ALL targets, looking back at the charts from first posting ... 15 months ago:
Best,
David Alcindor
PS:
Most recent chart;
노트
11 FEB 2016 - ADDENDUM: At 1.618-Fib, price may have reached a nadir in
 UKOIL:
Best,
David Alcindor
노트
11 FEB 2016 - ADDENDUM #2:Look for $17.21 being the next probable level of support if 1.618-Fib fails ... This would loosely correspond to the original
USOIL's 21.02 target defined in FEB 2015:Best,
David Alcindor

관련 발행물
면책사항
해당 정보와 게시물은 금융, 투자, 트레이딩 또는 기타 유형의 조언이나 권장 사항으로 간주되지 않으며, 트레이딩뷰에서 제공하거나 보증하는 것이 아닙니다. 자세한 내용은 이용 약관을 참조하세요.
면책사항
해당 정보와 게시물은 금융, 투자, 트레이딩 또는 기타 유형의 조언이나 권장 사항으로 간주되지 않으며, 트레이딩뷰에서 제공하거나 보증하는 것이 아닙니다. 자세한 내용은 이용 약관을 참조하세요.