
Hi there,
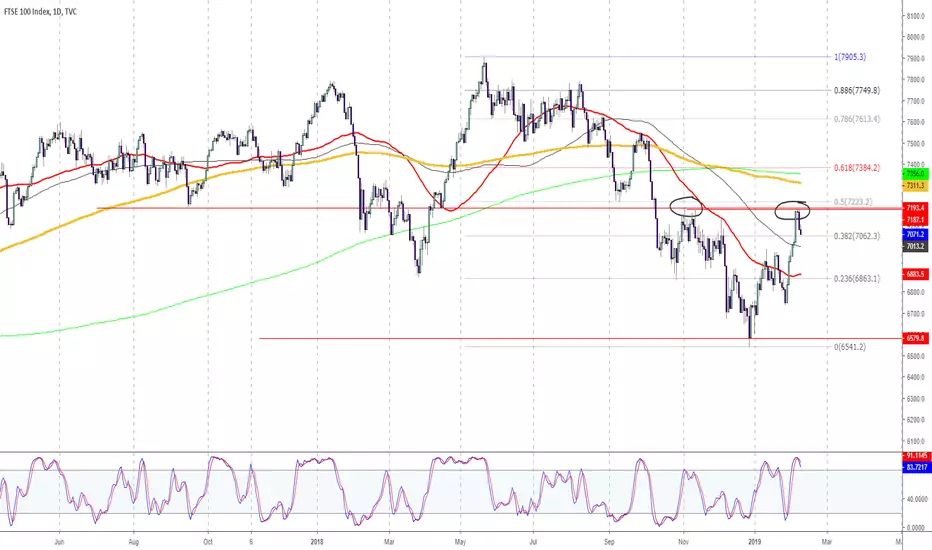
The way i see things (purely my opinion only), technically it makes sense to me why there has been a rejection late last week of the recent rise up.
You may be asking - what is in the way for resistance levels? Well,
We have
- September low (red horizontal line)
- November high (red horizontal line)
- 50% Fib from recent low/high in the way
It is quite possible we may see some weakness next week - based on my daily chart review.
Notes:
Green line = 500 day SMA
Black line = 100 day SMA
Yellow Line = 200 day SMA
Red Line = 55 day SMA
I only use one indicator being the slow stochastic indicator.
No dramas.
bazzman78t
09/02/2019
The way i see things (purely my opinion only), technically it makes sense to me why there has been a rejection late last week of the recent rise up.
You may be asking - what is in the way for resistance levels? Well,
We have
- September low (red horizontal line)
- November high (red horizontal line)
- 50% Fib from recent low/high in the way
It is quite possible we may see some weakness next week - based on my daily chart review.
Notes:
Green line = 500 day SMA
Black line = 100 day SMA
Yellow Line = 200 day SMA
Red Line = 55 day SMA
I only use one indicator being the slow stochastic indicator.
No dramas.
bazzman78t
09/02/2019

bazzman78tv
Updated December 2021
Updated December 2021
면책사항
해당 정보와 게시물은 금융, 투자, 트레이딩 또는 기타 유형의 조언이나 권장 사항으로 간주되지 않으며, 트레이딩뷰에서 제공하거나 보증하는 것이 아닙니다. 자세한 내용은 이용 약관을 참조하세요.
bazzman78tv
Updated December 2021
Updated December 2021
면책사항
해당 정보와 게시물은 금융, 투자, 트레이딩 또는 기타 유형의 조언이나 권장 사항으로 간주되지 않으며, 트레이딩뷰에서 제공하거나 보증하는 것이 아닙니다. 자세한 내용은 이용 약관을 참조하세요.