
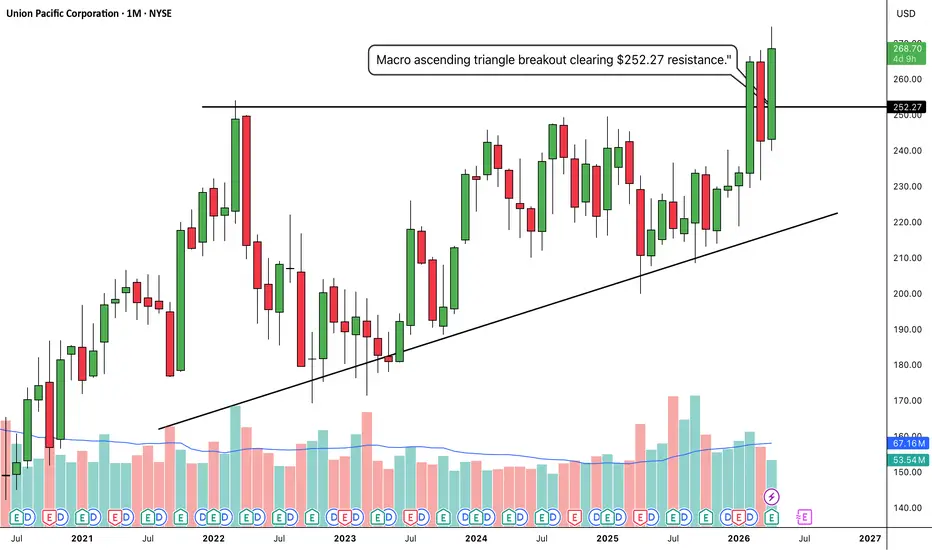
The Setup (Bias): I am taking a LONG bias on Union Pacific Corporation (UNP) on the macro monthly (1M) timeframe.
The "Why" (Technical Reasons): 1. Ascending Triangle Breakout: The price has powerfully broken out of a massive, multi-year ascending triangle pattern. After years of buyers continually stepping in at higher prices (indicated by the rising lower trendline), they have finally overwhelmed the sellers and cleared the flat-top historical resistance at $252.27.
2. Macro Bullish Momentum: The breakout is confirmed by a strong, full-bodied monthly green candle. Breaking out of a structural pattern of this size on a monthly chart indicates a high probability of a sustained, long-term trend continuation.
Trade Plan (Entry & Exits): * Entry: Momentum and position traders can look for entries near the current market price of $268.70. A more conservative, lower-risk approach would be scaling in on a potential monthly pullback to retest the $252.27 breakout line, letting that old historic ceiling prove itself as a new floor.
Take Profit (Target): Based on the measured move of a triangle this large, the momentum can carry it significantly higher. The next major psychological target is the $300.00 milestone, followed by $320.00.
Stop Loss: Placed safely below the breakout line and the rising trendline support, around $230.00. A monthly close below this level would invalidate the ascending triangle structure.
Duration: Because this analysis is built on a massive 1-Month chart, this is a long-term position trade designed to play out over the coming months to years.
The "Why" (Technical Reasons): 1. Ascending Triangle Breakout: The price has powerfully broken out of a massive, multi-year ascending triangle pattern. After years of buyers continually stepping in at higher prices (indicated by the rising lower trendline), they have finally overwhelmed the sellers and cleared the flat-top historical resistance at $252.27.
2. Macro Bullish Momentum: The breakout is confirmed by a strong, full-bodied monthly green candle. Breaking out of a structural pattern of this size on a monthly chart indicates a high probability of a sustained, long-term trend continuation.
Trade Plan (Entry & Exits): * Entry: Momentum and position traders can look for entries near the current market price of $268.70. A more conservative, lower-risk approach would be scaling in on a potential monthly pullback to retest the $252.27 breakout line, letting that old historic ceiling prove itself as a new floor.
Take Profit (Target): Based on the measured move of a triangle this large, the momentum can carry it significantly higher. The next major psychological target is the $300.00 milestone, followed by $320.00.
Stop Loss: Placed safely below the breakout line and the rising trendline support, around $230.00. A monthly close below this level would invalidate the ascending triangle structure.
Duration: Because this analysis is built on a massive 1-Month chart, this is a long-term position trade designed to play out over the coming months to years.
거래청산: 타겟 닿음
Target already achieved.
면책사항
해당 정보와 게시물은 금융, 투자, 트레이딩 또는 기타 유형의 조언이나 권장 사항으로 간주되지 않으며, 트레이딩뷰에서 제공하거나 보증하는 것이 아닙니다. 자세한 내용은 이용 약관을 참조하세요.
면책사항
해당 정보와 게시물은 금융, 투자, 트레이딩 또는 기타 유형의 조언이나 권장 사항으로 간주되지 않으며, 트레이딩뷰에서 제공하거나 보증하는 것이 아닙니다. 자세한 내용은 이용 약관을 참조하세요.