Long
Price Bounced Up From the Support But with a Weaker Structure
Previous US100 Chart Update :
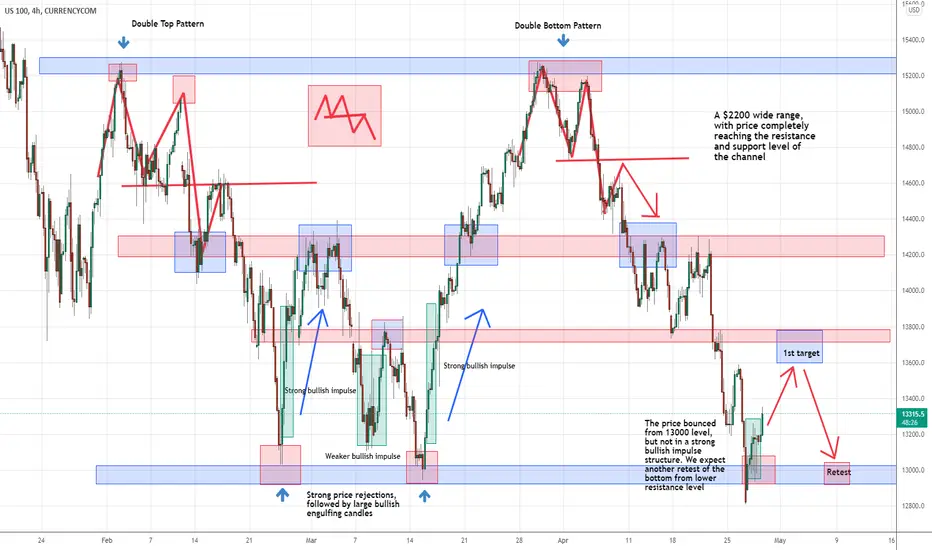
Since February, US100 has been moving in a $2200 wide range. This range is very wide, but the price has succeeded in reaching the resistance and support levels multiple times. This shows that an immediate break is not likely at key levels and might at least require multiple short-term re-tests before the levels can be broken.
We expected a rejection from the support level of 13000. The price bounced up but not in a strong bullish candlestick combination as we expected. Therefore, with a weaker bullish impulse structure. we lowered our first target area from 14300 level to 13700 level. We expect that from 13700 level, the price could potentially drop again to retest the support level of 13000.
We are currently viewing US100 as a ranging market until $13000 support level is clearly broken to the downside.
Since February, US100 has been moving in a $2200 wide range. This range is very wide, but the price has succeeded in reaching the resistance and support levels multiple times. This shows that an immediate break is not likely at key levels and might at least require multiple short-term re-tests before the levels can be broken.
We expected a rejection from the support level of 13000. The price bounced up but not in a strong bullish candlestick combination as we expected. Therefore, with a weaker bullish impulse structure. we lowered our first target area from 14300 level to 13700 level. We expect that from 13700 level, the price could potentially drop again to retest the support level of 13000.
We are currently viewing US100 as a ranging market until $13000 support level is clearly broken to the downside.

면책사항
해당 정보와 게시물은 금융, 투자, 트레이딩 또는 기타 유형의 조언이나 권장 사항으로 간주되지 않으며, 트레이딩뷰에서 제공하거나 보증하는 것이 아닙니다. 자세한 내용은 이용 약관을 참조하세요.
면책사항
해당 정보와 게시물은 금융, 투자, 트레이딩 또는 기타 유형의 조언이나 권장 사항으로 간주되지 않으며, 트레이딩뷰에서 제공하거나 보증하는 것이 아닙니다. 자세한 내용은 이용 약관을 참조하세요.