
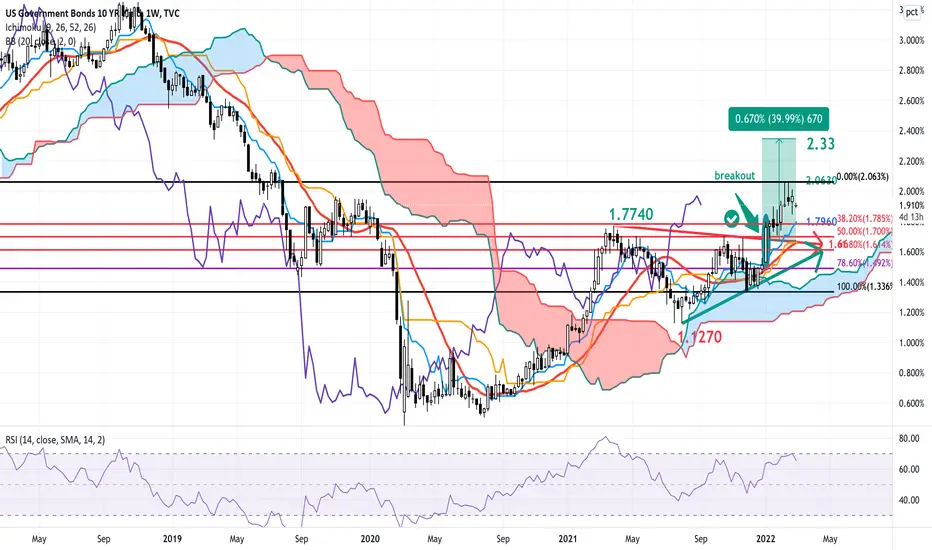
WEEKLY (W1)
Looks like a corrective move which should, for the time being, be seen as a consolidation phase or pullback towards the triangle pattern breakout level !
Indeed, looking at the weekly picture, we can identify two important support levels, which are the following :
S1 : 1.7960 (Tenkan-Sen) also roughly the 38.2% Fib ret (@ 1.7850 % of the last 1.3360 %-2.0630 % move
S2 : 1.6600 (Kijun-Sen and Mid Bollinger Band) and former downtrend line resistance which became the new support
Interesting to note that the 61.8% Fibonacci retracement is @ 1.6140 % which roughly coincides with the apex of the triangle pattern !
A breakout of 1.66 would put the focus on the weekly clouds support zone & 78.6 % Fib ret extension @ 1.4920 %
On the upside, the triangle technical target remains @ 2.33 % and is still alive.
RSI above 50, @ 65.33
LAGGING LINE far above the clouds and KS and TS
DAILY (D1)
Currently still above the daily Kijun-Sen @ 1.8850
Next support on a Daily basis are the following :
S1 : 1.7850 %
S2 : 1.7000 %
s3 : 1.6140 % (bottom of the daily clouds support area)
RSI above 50, @ 51.07
LAGGING LINE far above the clouds and also above both TS and KS
CONCLUSION :
Watch and monitor very carefully price action on shorter intraday time frames (H4, H1 and 15 minutes) to get clues which will help you to validate or invalidate the implications of the scenarios above mentioned for longer (D1 and W1 time frames)
Have a nice trading week.
All the best and take care
IRONMAN8848 & Jean-Pierre Burki
Looks like a corrective move which should, for the time being, be seen as a consolidation phase or pullback towards the triangle pattern breakout level !
Indeed, looking at the weekly picture, we can identify two important support levels, which are the following :
S1 : 1.7960 (Tenkan-Sen) also roughly the 38.2% Fib ret (@ 1.7850 % of the last 1.3360 %-2.0630 % move
S2 : 1.6600 (Kijun-Sen and Mid Bollinger Band) and former downtrend line resistance which became the new support
Interesting to note that the 61.8% Fibonacci retracement is @ 1.6140 % which roughly coincides with the apex of the triangle pattern !
A breakout of 1.66 would put the focus on the weekly clouds support zone & 78.6 % Fib ret extension @ 1.4920 %
On the upside, the triangle technical target remains @ 2.33 % and is still alive.
RSI above 50, @ 65.33
LAGGING LINE far above the clouds and KS and TS
DAILY (D1)
Currently still above the daily Kijun-Sen @ 1.8850
Next support on a Daily basis are the following :
S1 : 1.7850 %
S2 : 1.7000 %
s3 : 1.6140 % (bottom of the daily clouds support area)
RSI above 50, @ 51.07
LAGGING LINE far above the clouds and also above both TS and KS
CONCLUSION :
Watch and monitor very carefully price action on shorter intraday time frames (H4, H1 and 15 minutes) to get clues which will help you to validate or invalidate the implications of the scenarios above mentioned for longer (D1 and W1 time frames)
Have a nice trading week.
All the best and take care
IRONMAN8848 & Jean-Pierre Burki

관련 발행물
면책사항
해당 정보와 게시물은 금융, 투자, 트레이딩 또는 기타 유형의 조언이나 권장 사항으로 간주되지 않으며, 트레이딩뷰에서 제공하거나 보증하는 것이 아닙니다. 자세한 내용은 이용 약관을 참조하세요.
면책사항
해당 정보와 게시물은 금융, 투자, 트레이딩 또는 기타 유형의 조언이나 권장 사항으로 간주되지 않으며, 트레이딩뷰에서 제공하거나 보증하는 것이 아닙니다. 자세한 내용은 이용 약관을 참조하세요.