
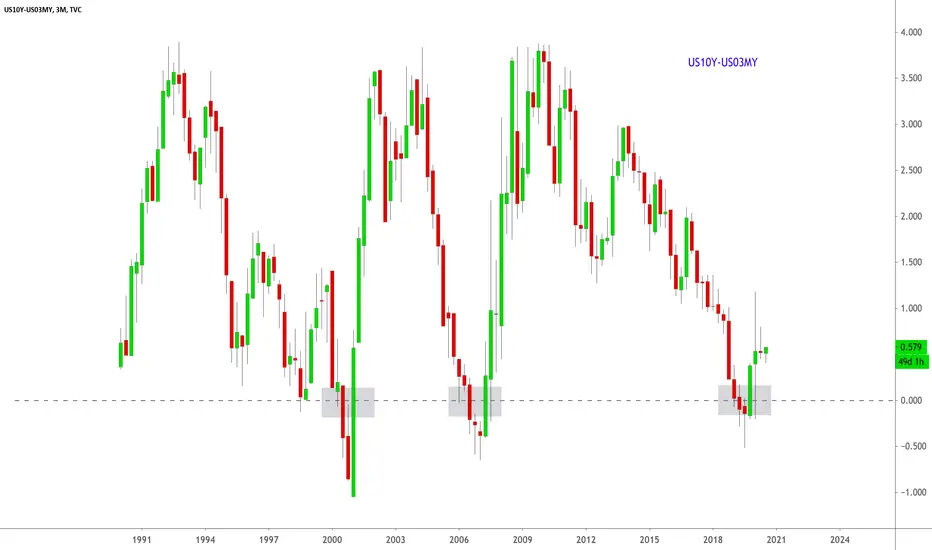
This was the first chart that signaled a recession in April of 2020 when the curve first inverted last year in May. This was pure luck, by simply drawing a fractal of previous yield curve inversions from past recessions from May, which was around 360 days from the TA that suggested the market would recess in April of 2020. Obviously covid is a black-swan--unpredictable and un-speculative--however the bond markets continue to get this all correct, 6-12 months in advance.
Keep your tabs on the curve.
Keep your tabs on the curve.

관련 발행물
면책사항
해당 정보와 게시물은 금융, 투자, 트레이딩 또는 기타 유형의 조언이나 권장 사항으로 간주되지 않으며, 트레이딩뷰에서 제공하거나 보증하는 것이 아닙니다. 자세한 내용은 이용 약관을 참조하세요.
면책사항
해당 정보와 게시물은 금융, 투자, 트레이딩 또는 기타 유형의 조언이나 권장 사항으로 간주되지 않으며, 트레이딩뷰에서 제공하거나 보증하는 것이 아닙니다. 자세한 내용은 이용 약관을 참조하세요.