
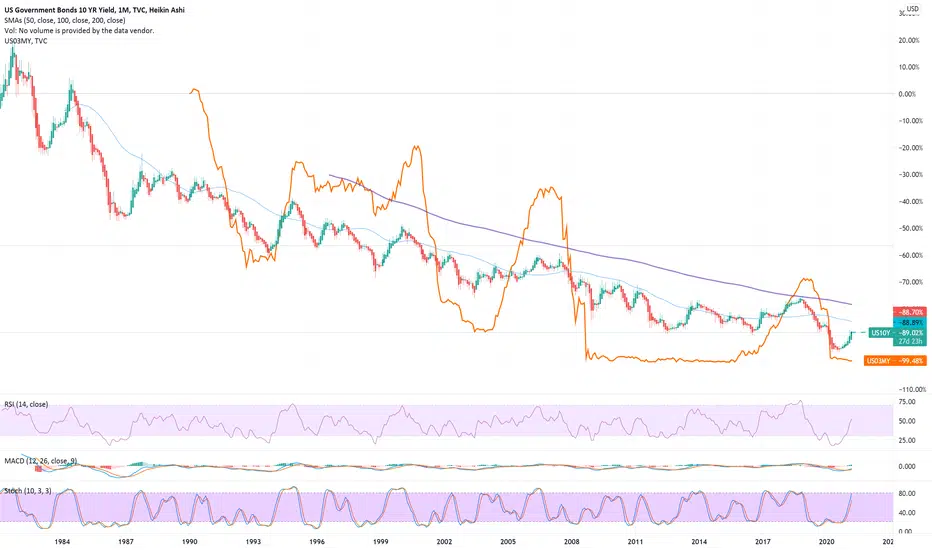
Not my idea, but it does seem to hold some water. Note the orange spikes above the 10 Yr T Bill and pull up history 1990/2000/2008 serious corrections
6-18 months after the 3 Mo/10yr treasury rates invert, the US economy goes into recession
1991 was a 33% drop, 2001 - 83%, 2008 - 54%
I've seen longer data sets that hold true even farther back from FRED
*NOT FINANCIAL ADVICE - NOT A FINANCIAL ADVISOR*
6-18 months after the 3 Mo/10yr treasury rates invert, the US economy goes into recession
1991 was a 33% drop, 2001 - 83%, 2008 - 54%
I've seen longer data sets that hold true even farther back from FRED
*NOT FINANCIAL ADVICE - NOT A FINANCIAL ADVISOR*
노트
Using the SPX500 above in Yellow, 3 historic times the 3Mo was > 10YrAverage SPX drop 40%
노트

면책사항
해당 정보와 게시물은 금융, 투자, 트레이딩 또는 기타 유형의 조언이나 권장 사항으로 간주되지 않으며, 트레이딩뷰에서 제공하거나 보증하는 것이 아닙니다. 자세한 내용은 이용 약관을 참조하세요.
면책사항
해당 정보와 게시물은 금융, 투자, 트레이딩 또는 기타 유형의 조언이나 권장 사항으로 간주되지 않으며, 트레이딩뷰에서 제공하거나 보증하는 것이 아닙니다. 자세한 내용은 이용 약관을 참조하세요.