
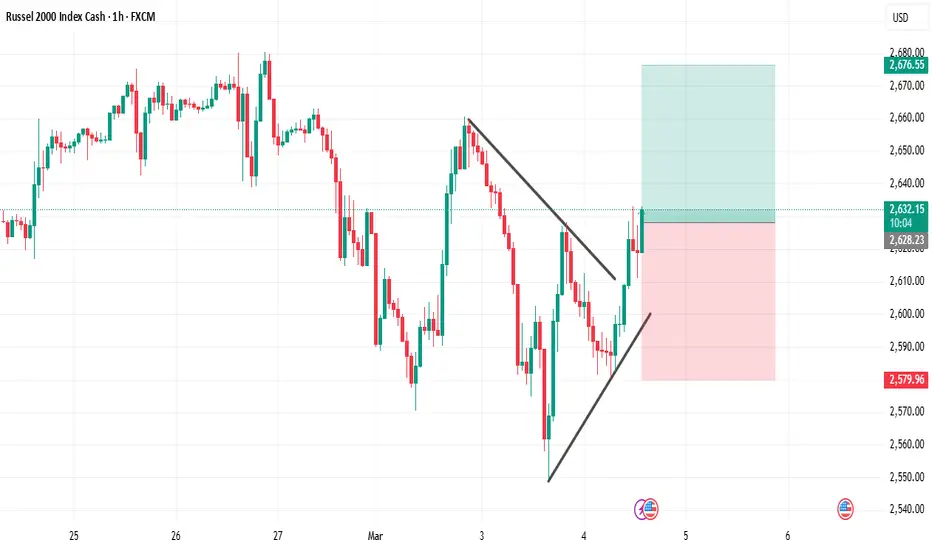
The Russell 2000 formed a symmetrical triangle after a strong sell-off, showing a period of compression where volatility started to decrease. These structures often precede a momentum expansion once price breaks out of the pattern.
Price has now broken above the triangle resistance, suggesting that short-term momentum could shift to the upside.
Entry 2628
Stop Loss 2579
TP 2676
Price has now broken above the triangle resistance, suggesting that short-term momentum could shift to the upside.
Entry 2628
Stop Loss 2579
TP 2676
거래청산: 스탑 닿음
Trade did not catch enough momentum. Trading plan respected
면책사항
해당 정보와 게시물은 금융, 투자, 트레이딩 또는 기타 유형의 조언이나 권장 사항으로 간주되지 않으며, 트레이딩뷰에서 제공하거나 보증하는 것이 아닙니다. 자세한 내용은 이용 약관을 참조하세요.
면책사항
해당 정보와 게시물은 금융, 투자, 트레이딩 또는 기타 유형의 조언이나 권장 사항으로 간주되지 않으며, 트레이딩뷰에서 제공하거나 보증하는 것이 아닙니다. 자세한 내용은 이용 약관을 참조하세요.