숏
US30: Price Forms a Rising Wedge Pattern
-INTRODUCTION-
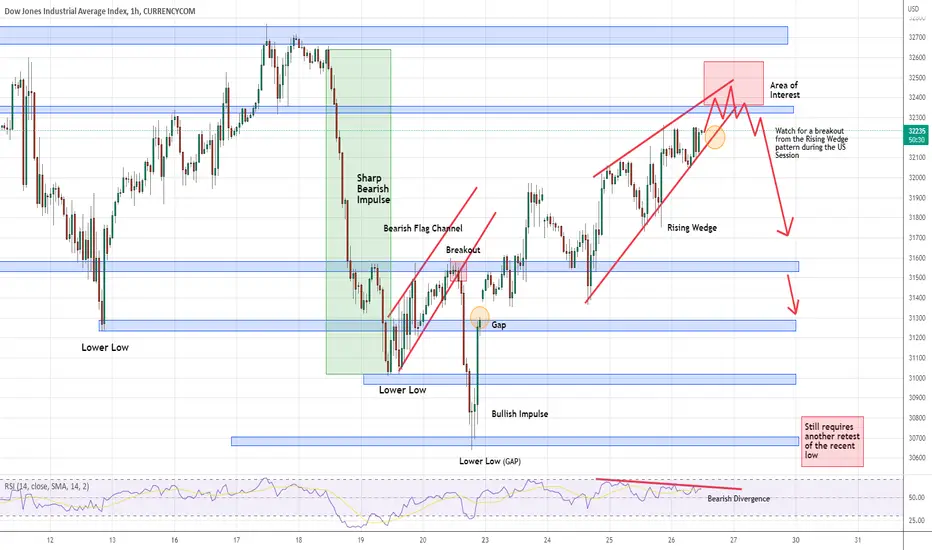
US30 currently has two gaps which are not filled. One is the recent low at the $30650 level while another one is at the $31300 level. In 1-hour chart, we can see that the price has formed a rising wedge pattern, along with a bearish divergence in RSI. Therefore, we expect a sharp bearish breakout sometimes very soon, similar to the last retracement breakout.
-TRADING PLAN-
We will carefully monitor the price movement during the US session today to see whether the price will break the rising wedge pattern.
We love to trade rising/falling wedge patterns. Breaking the pattern often creates a strong price impulse, especially when the pattern is formed as a retracement. Check out our recent retracement trading ideas below :)
US30 currently has two gaps which are not filled. One is the recent low at the $30650 level while another one is at the $31300 level. In 1-hour chart, we can see that the price has formed a rising wedge pattern, along with a bearish divergence in RSI. Therefore, we expect a sharp bearish breakout sometimes very soon, similar to the last retracement breakout.
-TRADING PLAN-
We will carefully monitor the price movement during the US session today to see whether the price will break the rising wedge pattern.
We love to trade rising/falling wedge patterns. Breaking the pattern often creates a strong price impulse, especially when the pattern is formed as a retracement. Check out our recent retracement trading ideas below :)

관련 발행물
면책사항
해당 정보와 게시물은 금융, 투자, 트레이딩 또는 기타 유형의 조언이나 권장 사항으로 간주되지 않으며, 트레이딩뷰에서 제공하거나 보증하는 것이 아닙니다. 자세한 내용은 이용 약관을 참조하세요.
관련 발행물
면책사항
해당 정보와 게시물은 금융, 투자, 트레이딩 또는 기타 유형의 조언이나 권장 사항으로 간주되지 않으며, 트레이딩뷰에서 제공하거나 보증하는 것이 아닙니다. 자세한 내용은 이용 약관을 참조하세요.