
US30 Sell Technical Analysis
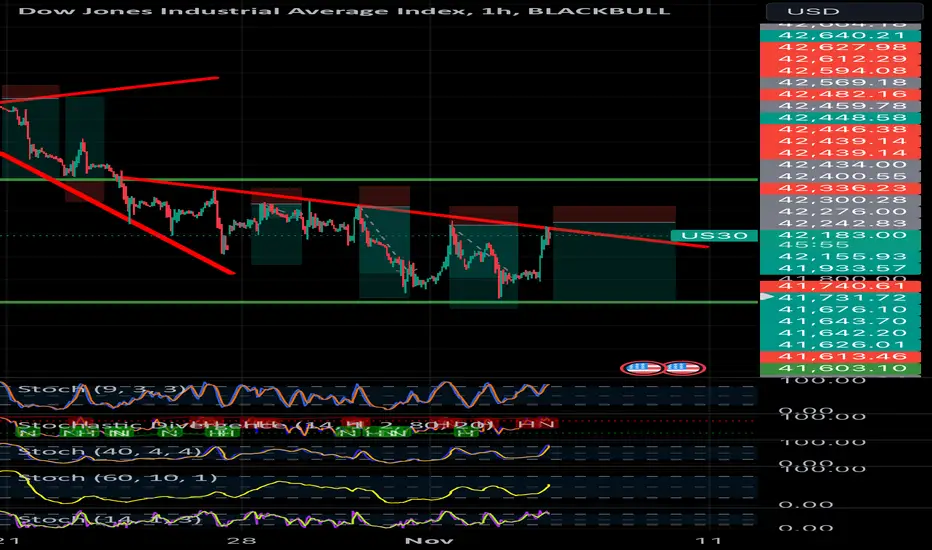
The US30 Dow Jones Industrial Average is currently showing a downtrend on the 1-hour chart, as evidenced by the descending trendline and multiple failed attempts to break above resistance. The Stochastic indicators also suggest overbought conditions, with the potential for a downward movement as momentum appears to be weakening. Additionally, previous rejections at the resistance zone highlight seller dominance in this range. A break below the support levels could accelerate selling pressure, making it a favorable setup for a short position.
The US30 Dow Jones Industrial Average is currently showing a downtrend on the 1-hour chart, as evidenced by the descending trendline and multiple failed attempts to break above resistance. The Stochastic indicators also suggest overbought conditions, with the potential for a downward movement as momentum appears to be weakening. Additionally, previous rejections at the resistance zone highlight seller dominance in this range. A break below the support levels could accelerate selling pressure, making it a favorable setup for a short position.

면책사항
해당 정보와 게시물은 금융, 투자, 트레이딩 또는 기타 유형의 조언이나 권장 사항으로 간주되지 않으며, 트레이딩뷰에서 제공하거나 보증하는 것이 아닙니다. 자세한 내용은 이용 약관을 참조하세요.
면책사항
해당 정보와 게시물은 금융, 투자, 트레이딩 또는 기타 유형의 조언이나 권장 사항으로 간주되지 않으며, 트레이딩뷰에서 제공하거나 보증하는 것이 아닙니다. 자세한 내용은 이용 약관을 참조하세요.