
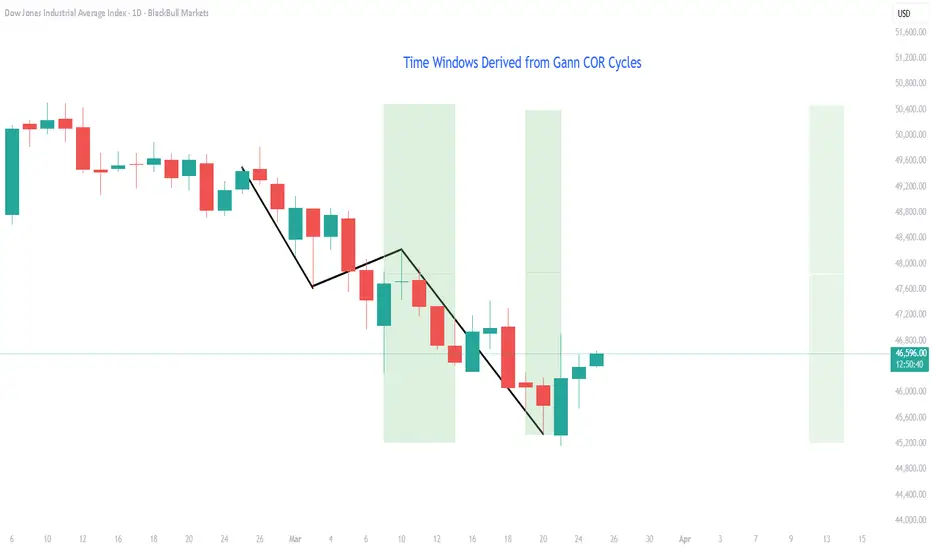
Gann COR cycles give mean pivot dates where price moves from High - Low - High.
No prediction of price in this chart, just windows of reversal pressure building in green shaded areas.
Look for buying pressure that is confirmed with candles and indicators between now and 10 April.
No prediction of price in this chart, just windows of reversal pressure building in green shaded areas.
Look for buying pressure that is confirmed with candles and indicators between now and 10 April.

면책사항
해당 정보와 게시물은 금융, 투자, 트레이딩 또는 기타 유형의 조언이나 권장 사항으로 간주되지 않으며, 트레이딩뷰에서 제공하거나 보증하는 것이 아닙니다. 자세한 내용은 이용 약관을 참조하세요.
면책사항
해당 정보와 게시물은 금융, 투자, 트레이딩 또는 기타 유형의 조언이나 권장 사항으로 간주되지 않으며, 트레이딩뷰에서 제공하거나 보증하는 것이 아닙니다. 자세한 내용은 이용 약관을 참조하세요.