
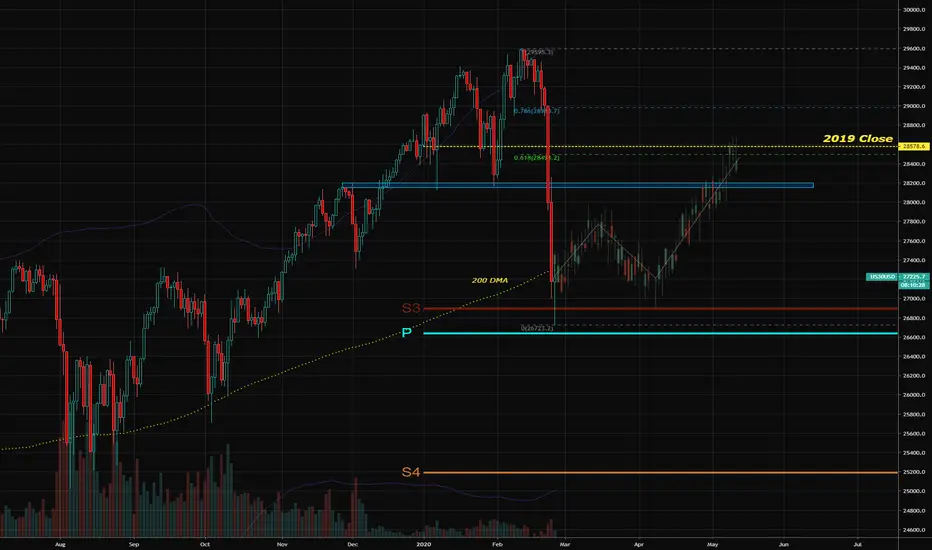
We have some major oversold readings yesterday and last night. I am predicting a bounce similar to FEB 2018. We tagged the Year CAM S3 target that I spoke of yesterday, and some other MAJOR targets as well for SPX500 futures.
노트
Major target struck on SPX500, backtesting the important trendline. 40 point overnight bounce. 노트
Percent stocks above 5DMA hits the lowest level seen since FEB 2018. We are mirroring that correction somewhat. 노트
DAX also got the super important trendline backtest 노트
30Y Bonds hit CAM Year R4. 노트
SPX hits 200 DMA, looks like a panic capitulation with a big gap down this morning. 노트
Year CAM S3 and July top. Where is the bottom? 노트
Percent stocks below 20 DMA crosses below 10%. This usually triggers a decent buy. 노트
So far this weekly candle is the largest percent selloff since OCT 2008. It even surpassed the SEP 2001 weekly candle.Next support (I guess) on NAS100 futures tradingview.com/chart/8SuRYefQ/
노트
Wrong link, here we go. Cyan channel = 55 day Donchian Close channel. 노트
VIX is at 45. The fear is real and this is total panic selling 노트
200 DMA on NAS100 did it. Massive amount of dark pool prints today. Bottom may be in for now. FEB 28 2020, 4:48 PM EST
VOL (K) | PRICE ($) | 🔼
--------.-----------.----------
📈
 SPY
SPY--------.-----------.----------
53,893 | 297.89 | 💚 +0.47%
4,000 | 290.63 | 💚 +2.98%
--------.-----------.----------
📈
 QQQ
QQQ--------.-----------.----------
5,672 | 205.78 | 💚 +0.50%
200 | 202.27 | 💚 +2.24%
--------.-----------.----------
📈
 VXX
VXX--------.-----------.----------
118 | 24.60 |💔 -10.04%
193 | 23.75 | 💔 -6.82%
680 | 22.33 | 💔 -0.90%
노트
Single highest trading volume for an ETF in history was Friday. 43% of stock market equity volume was in SPY.노트
Actually scratch that, not the single highest. Biggest in recent memory though.노트
Unprecedented dark pool activity again today, another 17 million in SPY blocks boosting this trade.We are nearing the classic backtest of Year S3 after bottoming on Year S4 for DJI futures.
노트
Near perfect gartley structures on ES, YM, NQ. 노트
We are repeating the same sequence of candles and pullbacks as the 2011 and 2015 corrections. The first wave up is complete, then retrace 70-80% of the first bottom, then build into the next week. We could hit 9200 NQ before the end of March. Sentiment is near all time extremes.
노트
Double tap on the NQ rail노트
10Y Bond capped on YEAR CAM R5. 노트
Bottom is likely in for NQ as we hit Year CAM S3 after topping on Year CAM R3. The normal play is a retracement back to the previous close, so the 2019 close. We are attempting to create some very large bullish divergences.The limit down % was hit monday for equity futures as well as the limit up for 10Y bond futures (5% overnight). The limit up was hit for ES this morning and limit down for 10Y bond futures.
These are wild whipsaws you never see. I believe the bottom is extremely close.
노트
Worst selloff since 2008.
노트
DJI trendline 노트
XLU trendline 노트
SPX pitchfork 
Find the edge.
Website: daily-edge.com
Twitter: twitter.com/dailyEdgeGroup
Youtube: youtube.com/c/TheDailyEdgeTradingGroup
Telegram: t.me/mortdiggiddy
Paypal: paypal.me/mortdiggiddy
Website: daily-edge.com
Twitter: twitter.com/dailyEdgeGroup
Youtube: youtube.com/c/TheDailyEdgeTradingGroup
Telegram: t.me/mortdiggiddy
Paypal: paypal.me/mortdiggiddy
관련 발행물
면책사항
해당 정보와 게시물은 금융, 투자, 트레이딩 또는 기타 유형의 조언이나 권장 사항으로 간주되지 않으며, 트레이딩뷰에서 제공하거나 보증하는 것이 아닙니다. 자세한 내용은 이용 약관을 참조하세요.
Find the edge.
Website: daily-edge.com
Twitter: twitter.com/dailyEdgeGroup
Youtube: youtube.com/c/TheDailyEdgeTradingGroup
Telegram: t.me/mortdiggiddy
Paypal: paypal.me/mortdiggiddy
Website: daily-edge.com
Twitter: twitter.com/dailyEdgeGroup
Youtube: youtube.com/c/TheDailyEdgeTradingGroup
Telegram: t.me/mortdiggiddy
Paypal: paypal.me/mortdiggiddy
관련 발행물
면책사항
해당 정보와 게시물은 금융, 투자, 트레이딩 또는 기타 유형의 조언이나 권장 사항으로 간주되지 않으며, 트레이딩뷰에서 제공하거나 보증하는 것이 아닙니다. 자세한 내용은 이용 약관을 참조하세요.