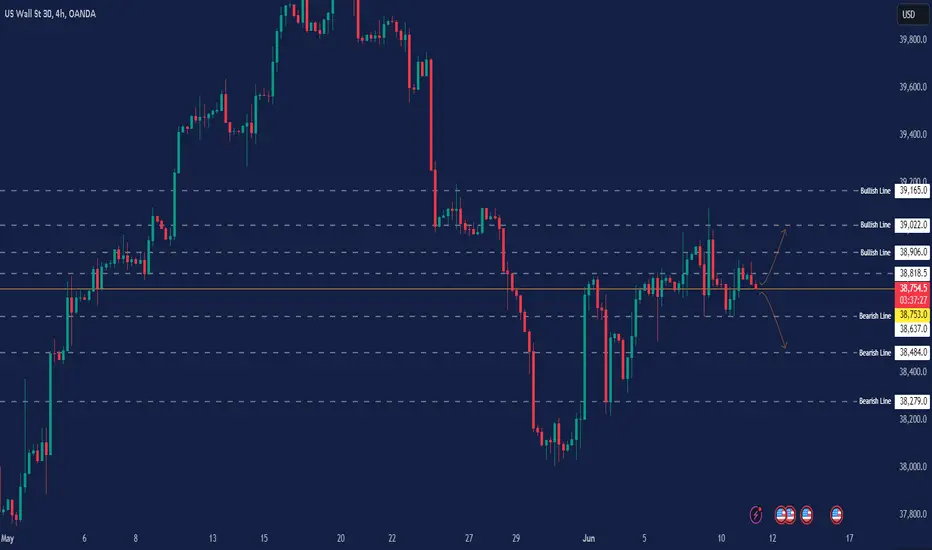
Based on the  US30USD chart, the price at 38790.0 is above the pivot point of 38753, indicating a bullish sentiment. If the price stays above this pivot, it could move towards Bullish levels at 38906 and 39022. Conversely, if it drops below the pivot point, it could target Bearish levels at 38637 and 38484. The current bias is bullish, but close monitoring around the pivot point is essential to confirm the market direction.
Key Levels:
Bullish Lines: 38818, 38906, 39022, 39165
Pivot Line: 38753
Bearish Line: 38637, 38484, 38279
US30USD chart, the price at 38790.0 is above the pivot point of 38753, indicating a bullish sentiment. If the price stays above this pivot, it could move towards Bullish levels at 38906 and 39022. Conversely, if it drops below the pivot point, it could target Bearish levels at 38637 and 38484. The current bias is bullish, but close monitoring around the pivot point is essential to confirm the market direction.Key Levels:
Bullish Lines: 38818, 38906, 39022, 39165
Pivot Line: 38753
Bearish Line: 38637, 38484, 38279

면책사항
해당 정보와 게시물은 금융, 투자, 트레이딩 또는 기타 유형의 조언이나 권장 사항으로 간주되지 않으며, 트레이딩뷰에서 제공하거나 보증하는 것이 아닙니다. 자세한 내용은 이용 약관을 참조하세요.
면책사항
해당 정보와 게시물은 금융, 투자, 트레이딩 또는 기타 유형의 조언이나 권장 사항으로 간주되지 않으며, 트레이딩뷰에서 제공하거나 보증하는 것이 아닙니다. 자세한 내용은 이용 약관을 참조하세요.