SPX - 1D
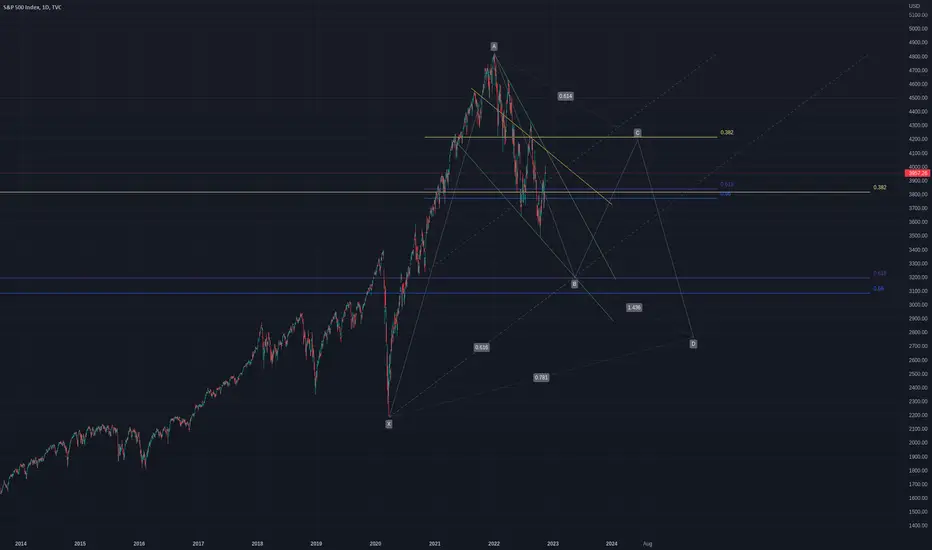
Green - Falling wedge resistance steeper than support
Yellow 0.382 fib resistance levels from swing lows (left) to high (right)
Blue/Purple 0.618 fib retracement levels for possible areas of support ( * would be good to include weekly, monthly and/or daily supports for confluence, but would crowd the chart)
Yellow diagonal possible resistance - breaks Green falling wedge (actually not sure why thats there, I think should we break above 0.382 would serve as possible resistance, 0.618 support, hmm)
Grey - Possible gartley harmonic - big time frame accuracy based on macro less probable
Grey dash - fib markers

면책사항
해당 정보와 게시물은 금융, 투자, 트레이딩 또는 기타 유형의 조언이나 권장 사항으로 간주되지 않으며, 트레이딩뷰에서 제공하거나 보증하는 것이 아닙니다. 자세한 내용은 이용 약관을 참조하세요.
면책사항
해당 정보와 게시물은 금융, 투자, 트레이딩 또는 기타 유형의 조언이나 권장 사항으로 간주되지 않으며, 트레이딩뷰에서 제공하거나 보증하는 것이 아닙니다. 자세한 내용은 이용 약관을 참조하세요.