숏
SP500 Forecast
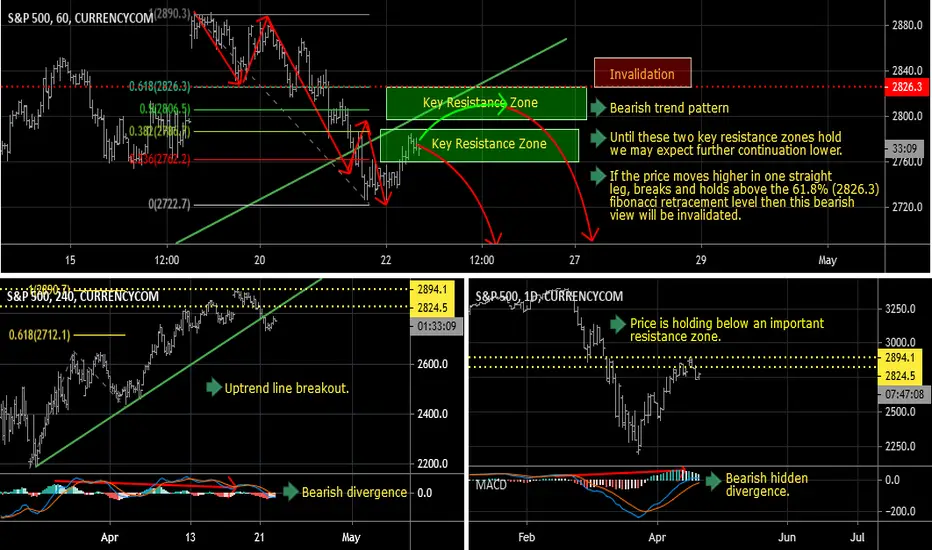
D1 - Price respected an important resistance zone and is holding below it, bearish hidden divergence.
H4 - Price has broken below the most recent uptrend line, bearish divergence.
H1 - Bearish trend pattern, until the two key resistance zones shown in the chart holds my view remains bearish here.
If the price moves higher in one straight leg, breaks and holds above the 61.8% (2826.3) fibonacci retracement level then this bearish view will be invalidated.
H4 - Price has broken below the most recent uptrend line, bearish divergence.
H1 - Bearish trend pattern, until the two key resistance zones shown in the chart holds my view remains bearish here.
If the price moves higher in one straight leg, breaks and holds above the 61.8% (2826.3) fibonacci retracement level then this bearish view will be invalidated.

면책사항
해당 정보와 게시물은 금융, 투자, 트레이딩 또는 기타 유형의 조언이나 권장 사항으로 간주되지 않으며, 트레이딩뷰에서 제공하거나 보증하는 것이 아닙니다. 자세한 내용은 이용 약관을 참조하세요.
면책사항
해당 정보와 게시물은 금융, 투자, 트레이딩 또는 기타 유형의 조언이나 권장 사항으로 간주되지 않으며, 트레이딩뷰에서 제공하거나 보증하는 것이 아닙니다. 자세한 내용은 이용 약관을 참조하세요.