Uncertain S&P 500
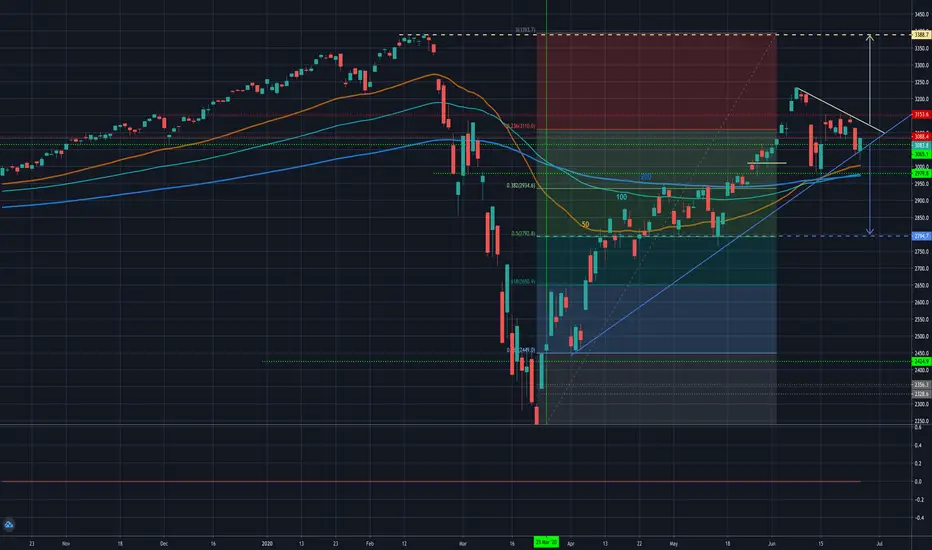
On my chart, you can see the triangle in which the price moves, the lower border of the triangle is indicated by blue colors and when it breaks down it can lead to a further drop in the price. And there is also the upper border of the triangle marked in yellow and when it is broken up, it will be a signal of further restoration of the market up to the previous maximum prices

면책사항
해당 정보와 게시물은 금융, 투자, 트레이딩 또는 기타 유형의 조언이나 권장 사항으로 간주되지 않으며, 트레이딩뷰에서 제공하거나 보증하는 것이 아닙니다. 자세한 내용은 이용 약관을 참조하세요.
면책사항
해당 정보와 게시물은 금융, 투자, 트레이딩 또는 기타 유형의 조언이나 권장 사항으로 간주되지 않으며, 트레이딩뷰에서 제공하거나 보증하는 것이 아닙니다. 자세한 내용은 이용 약관을 참조하세요.